
Gaps and Opportunities
in ADHD Therapy Processes
brand
role
Research
Strategy
UX/UI
time
2 months
tools
Figma
Miro
Notion
Asana
summary
As the Founding Designer at a pre-seed mental health startup, I led product discovery, uncovered key user needs, and turned insights into tested, shipped solutions. This resulted in an increase in therapy session bookings and growth in user engagement.
setting the stage
Cog is a mobile app designed to support people with ADHD. A significant part of its offering is online therapy delivered through Cog Clinic. My goal was to understand ADHD therapy from multiple perspectives to identify problems and uncover focused design opportunities.


MY ROLE

research >
I interviewed customers, therapists, and clinic staff, carried out a competitive analysis, and analysed findings with the team.

synthesis >
I identified friction points and improvement opportunities through affinity mapping, personas, and user journey analysis.

strategy >
The number of opportunities identified was striking and helped me shape the long-term vision for Cog Clinic.

design >
I was responsible for designing a feasible solution to address the most urgent issue within the existing resource constraints.
INTERVIEWS
HOLISTIC INSIGHTS
THROUGH 360° INTERVIEWS WITH…

Therapy clients
Cog Clinic customers who had prior experience with therapy

Therapists
Specialists experienced in providing therapy for individuals with ADHD

Clinic staff
Professionals at mental health clinics familiar with operational systems
My goal was to gain a deeper understanding of the ADHD therapy landscape so I could address our users' needs better.


Competitive Analysis
SPACE FOR OPPORTUNITY
IN THE THERAPY AIDING TOOLS
I identified a variety of solutions for ADHD support, generally divided into two categories: self-help apps and therapy platforms.


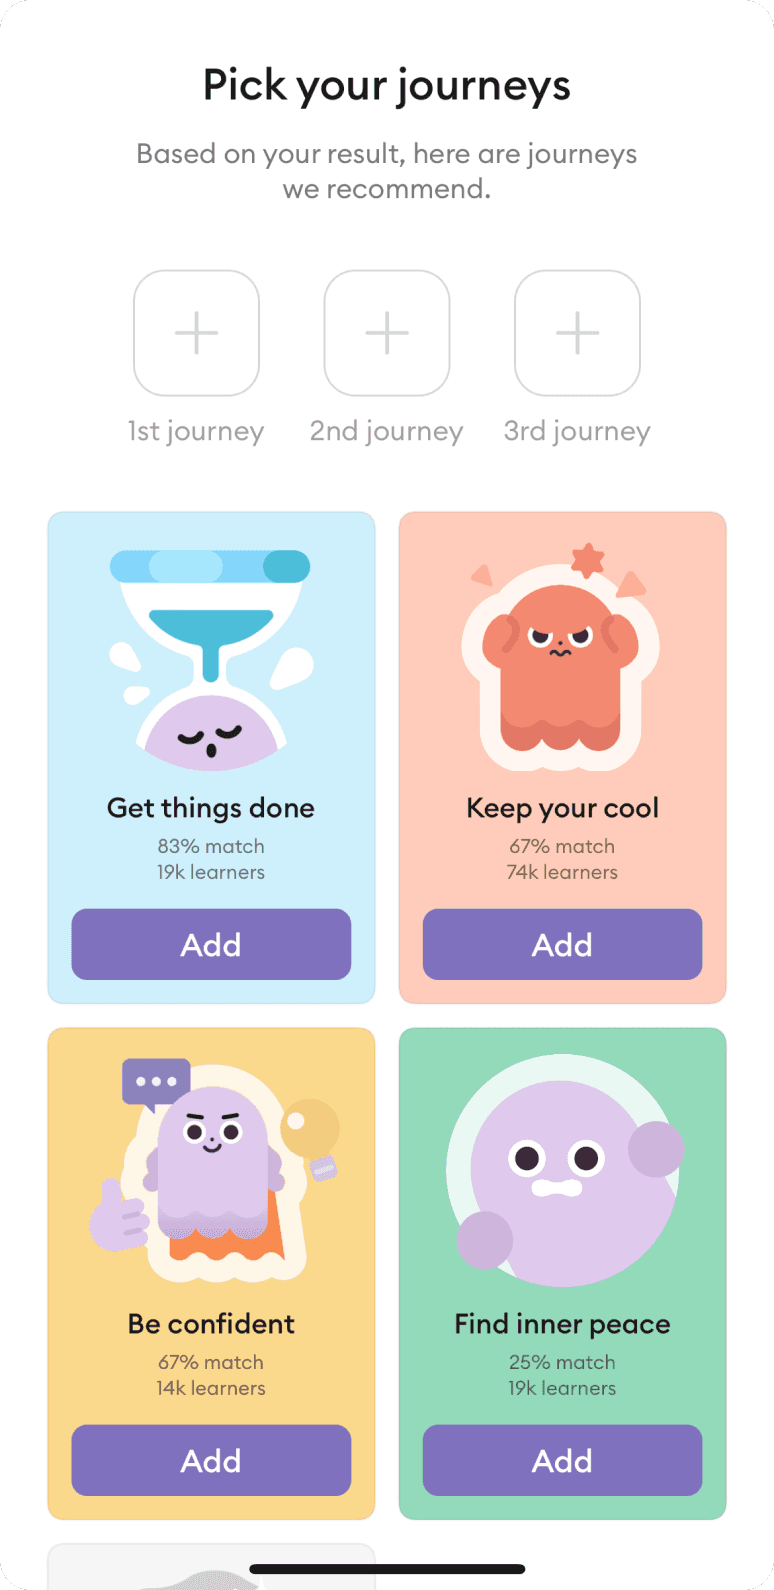
Self-help apps are typically designed to be engaging and fun, offering tools like mood check-ins, educational videos, and AI chatbots.
Therapy platforms generally offer access to coaches through monthly subscriptions but lack tools that directly support the therapy process. Only a few, including our key competitors Inflow and Agave Health, included features like emotion or symptom check-ins.
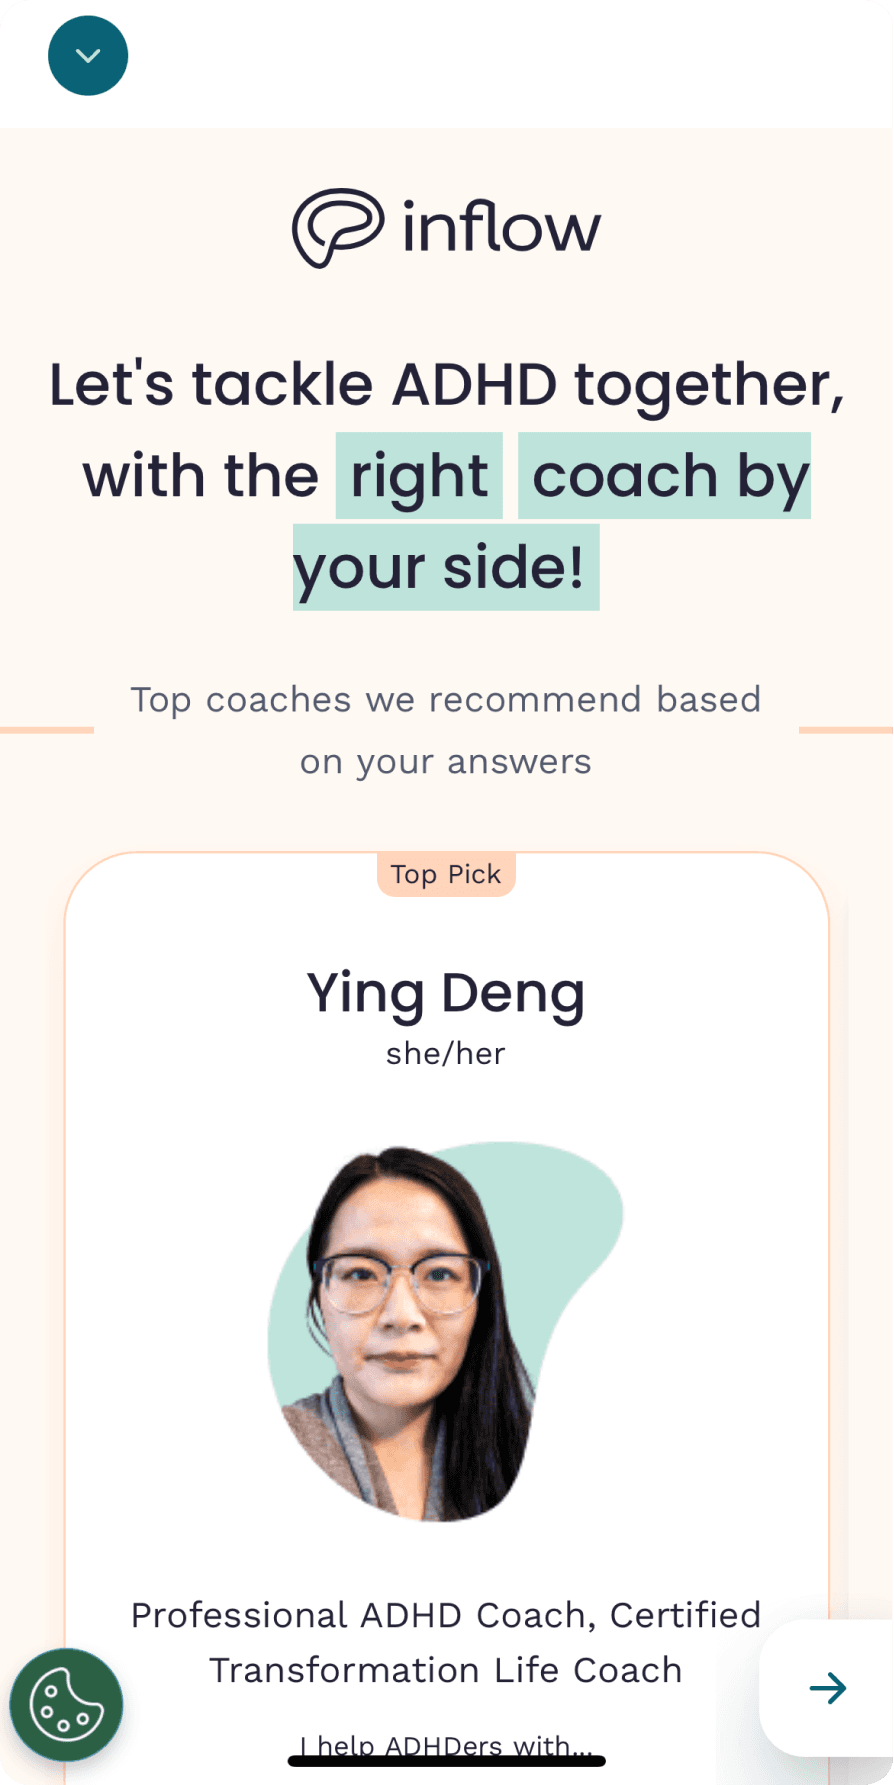
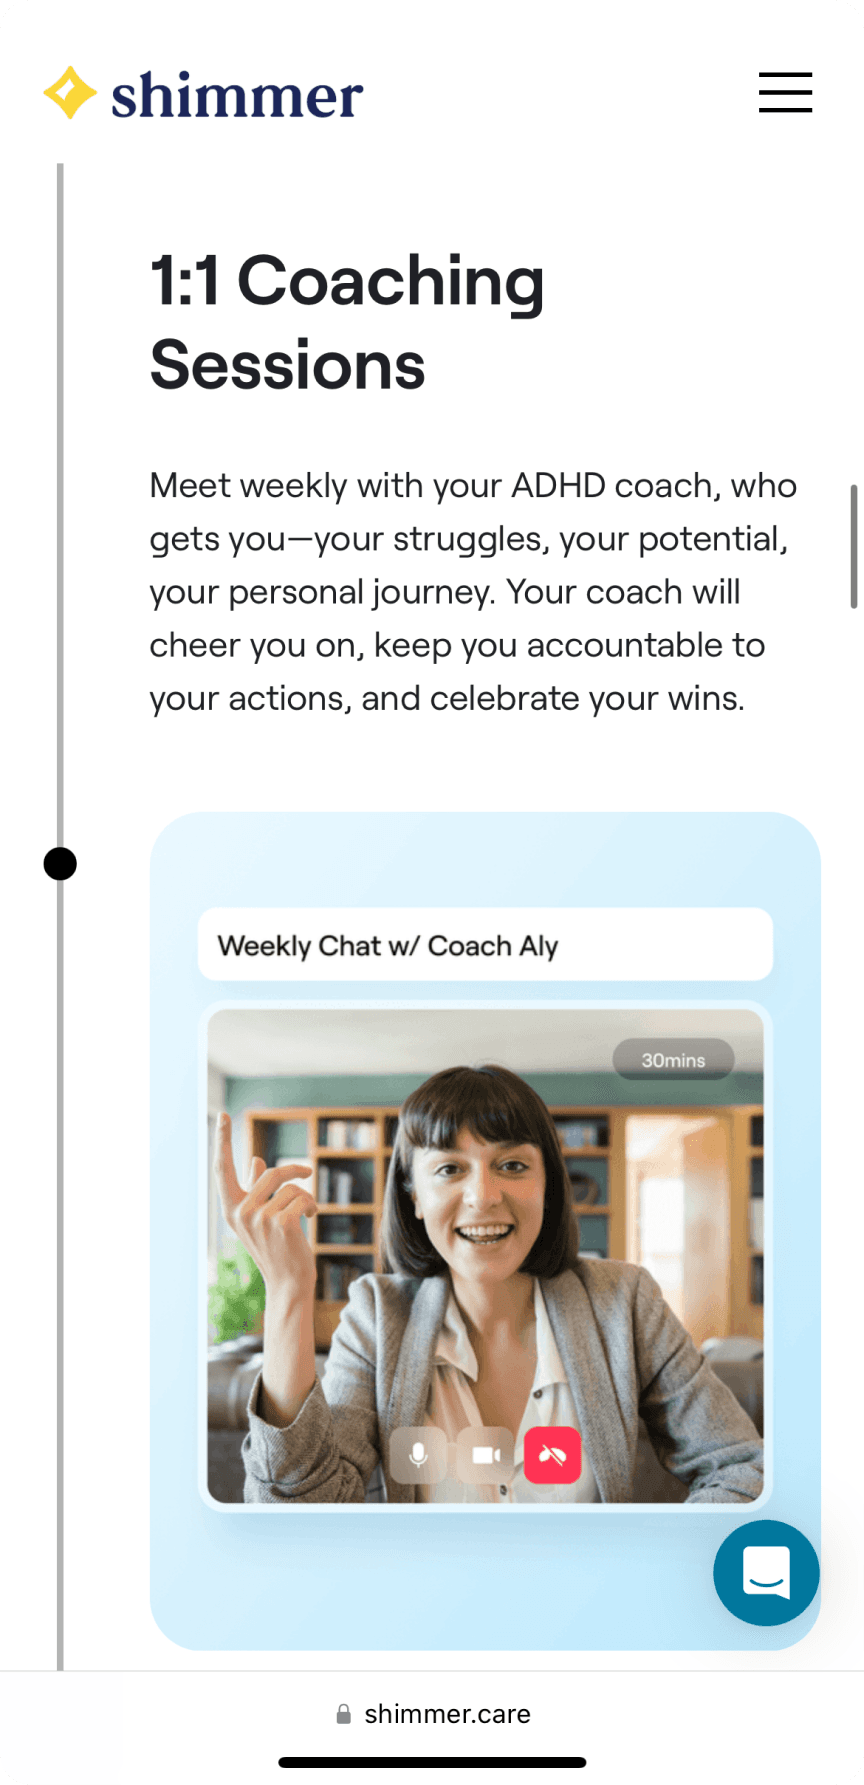
This gap in therapy-support tools indicated a unique opportunity to develop features that actively support the therapeutic journey.
Key research findings
Gaps in connection,
lack of structure and resources
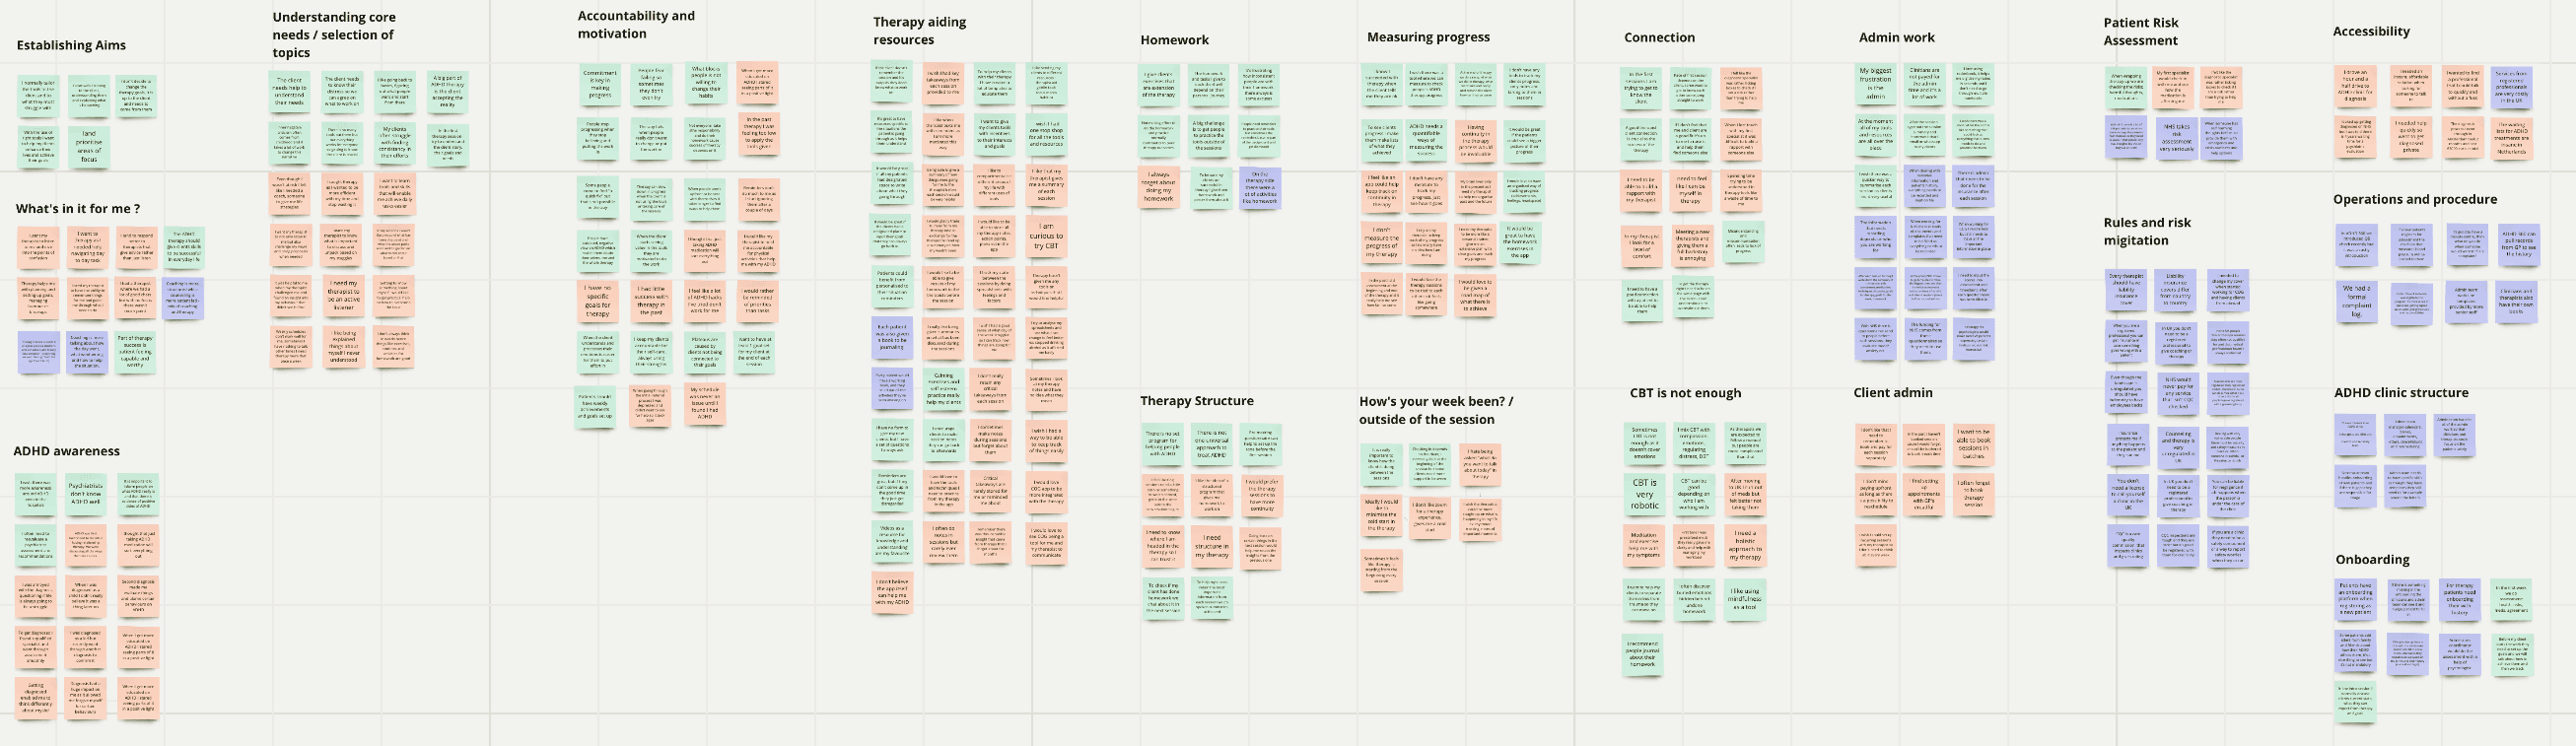
“Each week, I'm asked how my week's been, but all I remember is the last meeting I've had that day so we end up chatting about the first thing that comes to my mind”
“Biggest challenge I face is a lack of engagement from my clients.”
“I wish that I had a good sense of what day of the week I struggled with. I tried tracking it, especially when on medication, so then I know how things are going for me”
Insight #01
Defining needs and goals is crucial yet challenging
Effective therapy relies on clients understanding their emotions and goals, but many struggle to express them, often giving vague responses like “I want to complete tasks more easily” because their needs aren’t fully clear.
Insight #02
session structure leads to unfocused therapy
Sessions often start with “How’s your week been?”, often leading clients to recall recent events instead of key issues. This impacts the focus and outcomes of therapy.
Insight #03
clients' motivation dips
without visible progress
Clients are driven by visible progress, but therapists lack structured tools to track it. Without consistent tracking, clients struggle to see improvements, leading to a lack of motivation.
Insight #04
therapists are drowning in administrative work
Therapists handle extensive admin tasks including session summaries and risk assessments that can take 15–40 minutes per session, often unpaid. This extra workload contributes to burnout.
Session Booking Drop-off
Beyond the core insights, I identified a high-impact friction: users valued individual and flexible session booking but often forgot to rebook, even when they wanted to continue. This presented a clear opportunity for a quick, valuable fix.
CURRENT THERAPY PROCESS -
CLIENT JOURNEY MAP

Katherine Bell
“I need therapy with continuity, clear progress, and actionable insights readily available.”
scenario
Katherine is successful at work but struggles to balance it with her personal life and mental health, often feeling burnout. She wants to understand and manage her ADHD to feel less exhausted and anxious. Previous therapy felt chaotic and unexpected, leaving her unmotivated and uncertain about any progress.
expectations
- ·She wants to manage her ADHD effectively and work with a therapist she can build rapport with.
- ·She seeks structured therapy with clear progress tracking to stay motivated.
- ·She hopes her therapist will help identify key focus areas, reducing the burden of recall.

Strategy
Transforming therapy
with AI and data-driven solutions
The issues I uncovered revealed many opportunities for improvement. I began to imagine, what could a big picture product vision for Cog clinic look like?
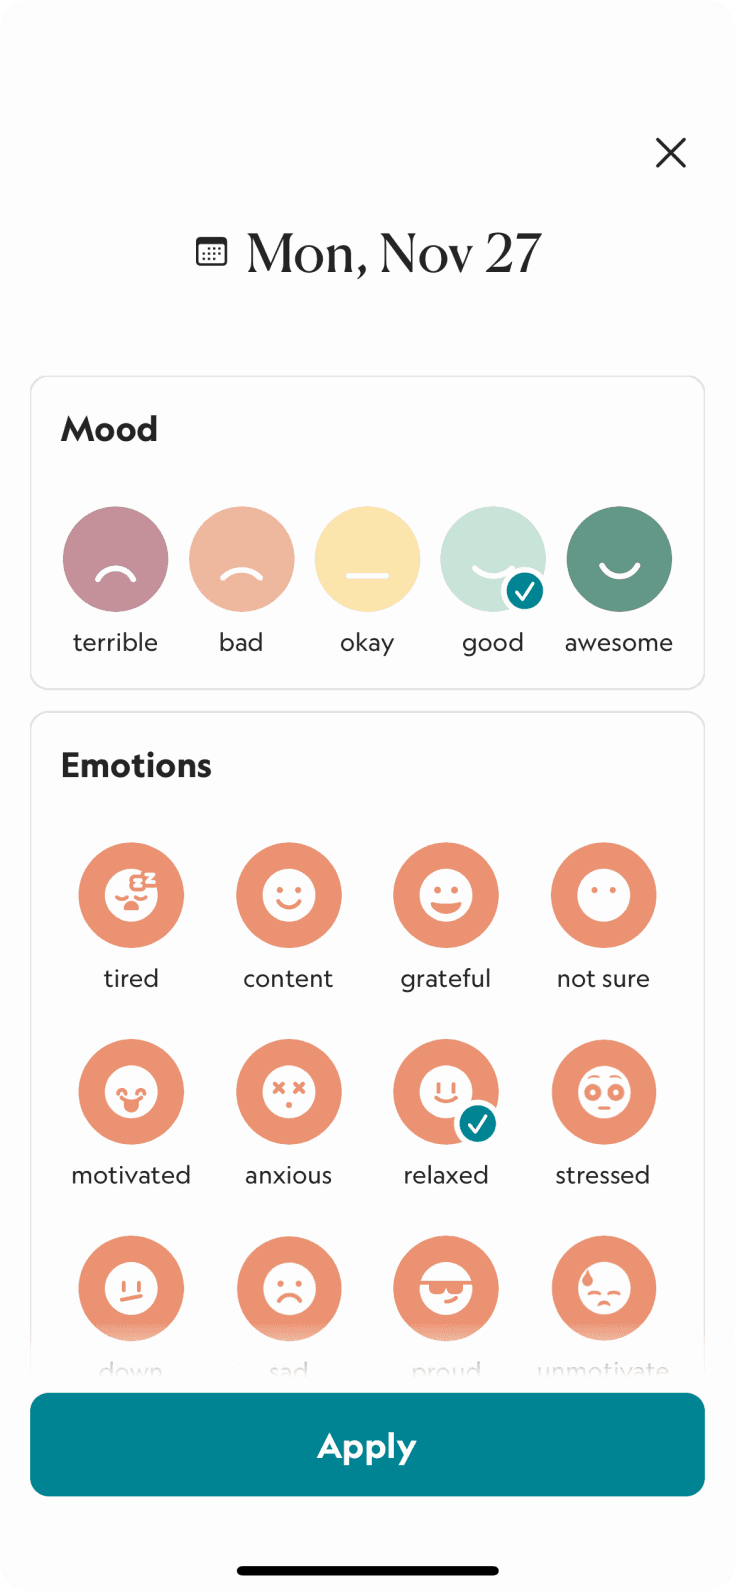
Cog allows users to track symptoms, emotions, wins and add daily journal entries for context.
Why not use these tools to give users a clear, insightful view of their progress and overall well-being?


This would also give therapists a better understanding of their patient’s health and areas to focus on.
With structured data available before sessions, patients wouldn’t have to rely on memory, and seeing their progress could be a huge motivation boost.
Additionally, a centralised hub would keep therapy organised; session summaries, homework, communication, reminders, and an archive all in one place, so nothing ever gets lost.

Automating some of the admin work could further reduce clinician burnout. For example, after each session, AI could draft a session summary and risk assessment based on the user’s data, allowing therapists to simply review it.

METHODOLOGY
INVITING ENGINEERS
TO DISCUSSIONS EARLY ON
With this big vision in place, I focused on prioritising ideas. Transforming check in entries (symptoms, emotions, wins, and daily journals) into actionable insights would address key issues identified in the research.
Problem #01
Defining needs and goals is crucial yet challenging
Access to symptoms history would allow users to identify patterns enabling more targeted goals.
Problem #02
session structure leads to unfocused therapy
Users could use their check in data to share relevant information each week, streamlining session focus.
Problem #03
clients' motivation dips Without Visible Progress
Check in analytics could help users monitor symptoms and see their progress more clearly.
Early on, I worked with engineers to figure out what was realistic. Our backend setup in Firebase couldn't support complex data aggregation without a major restructure, so we went with a lightweight weekly check-in history to launch fast and learn quickly.
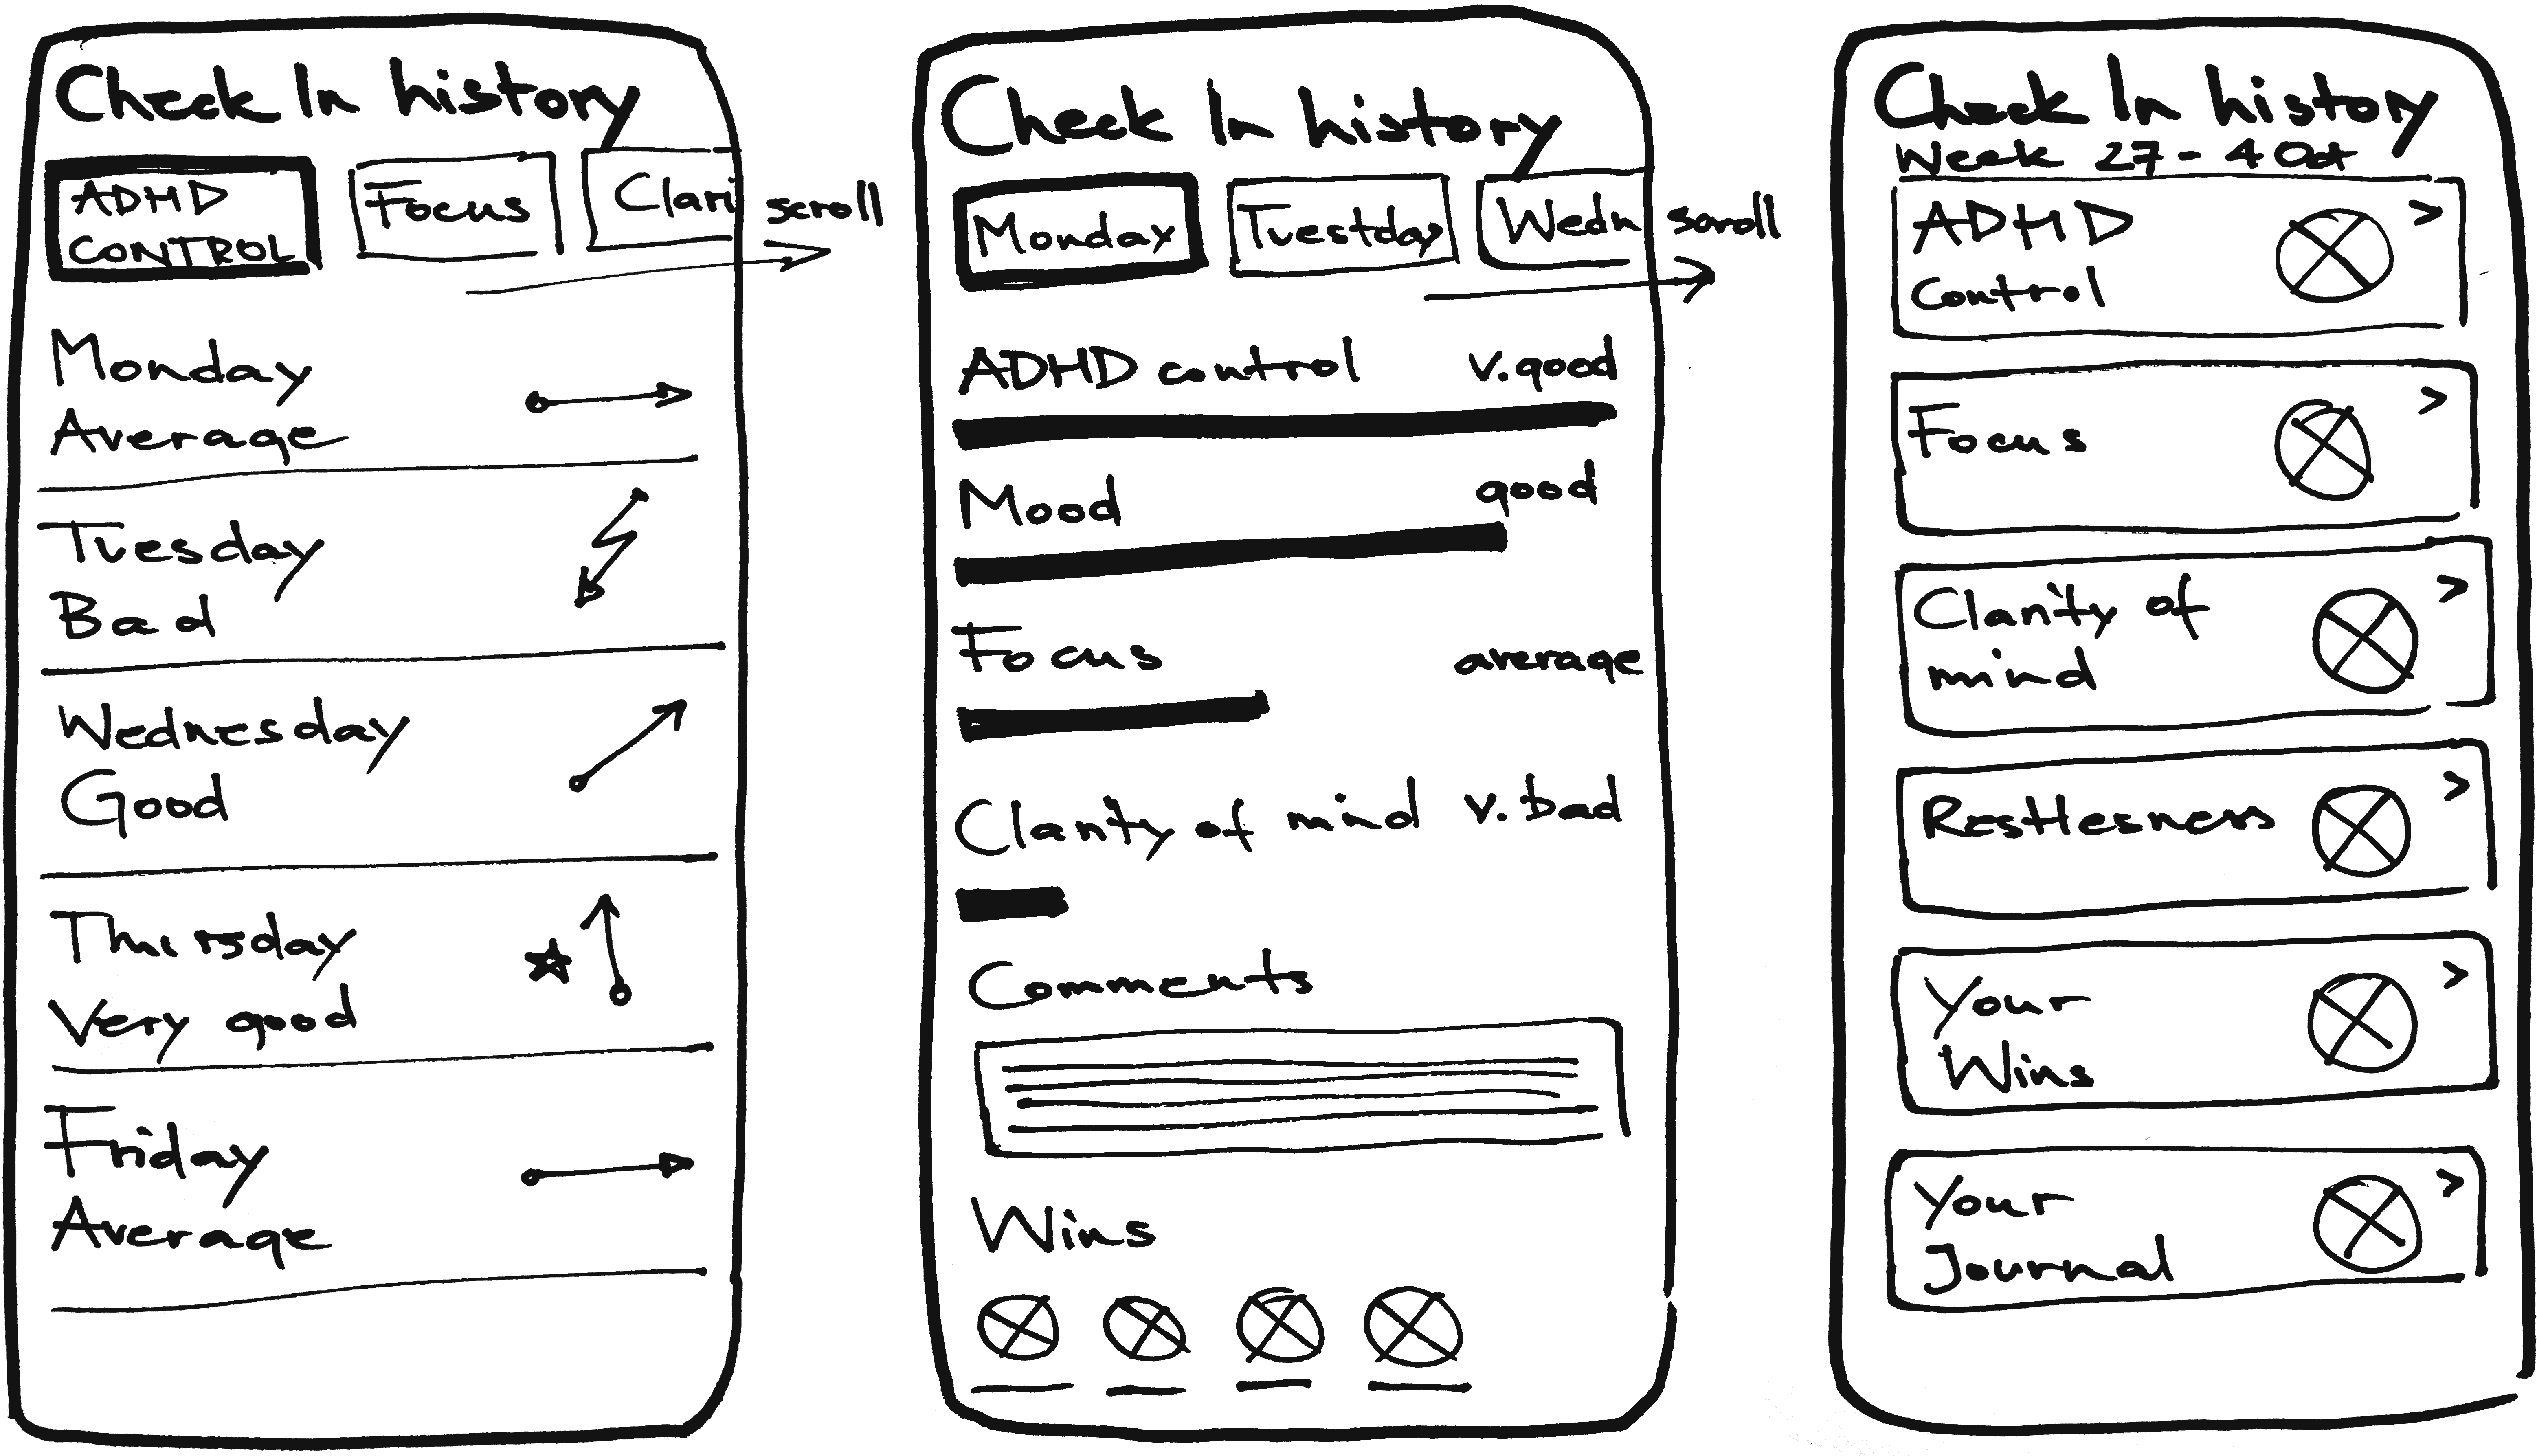
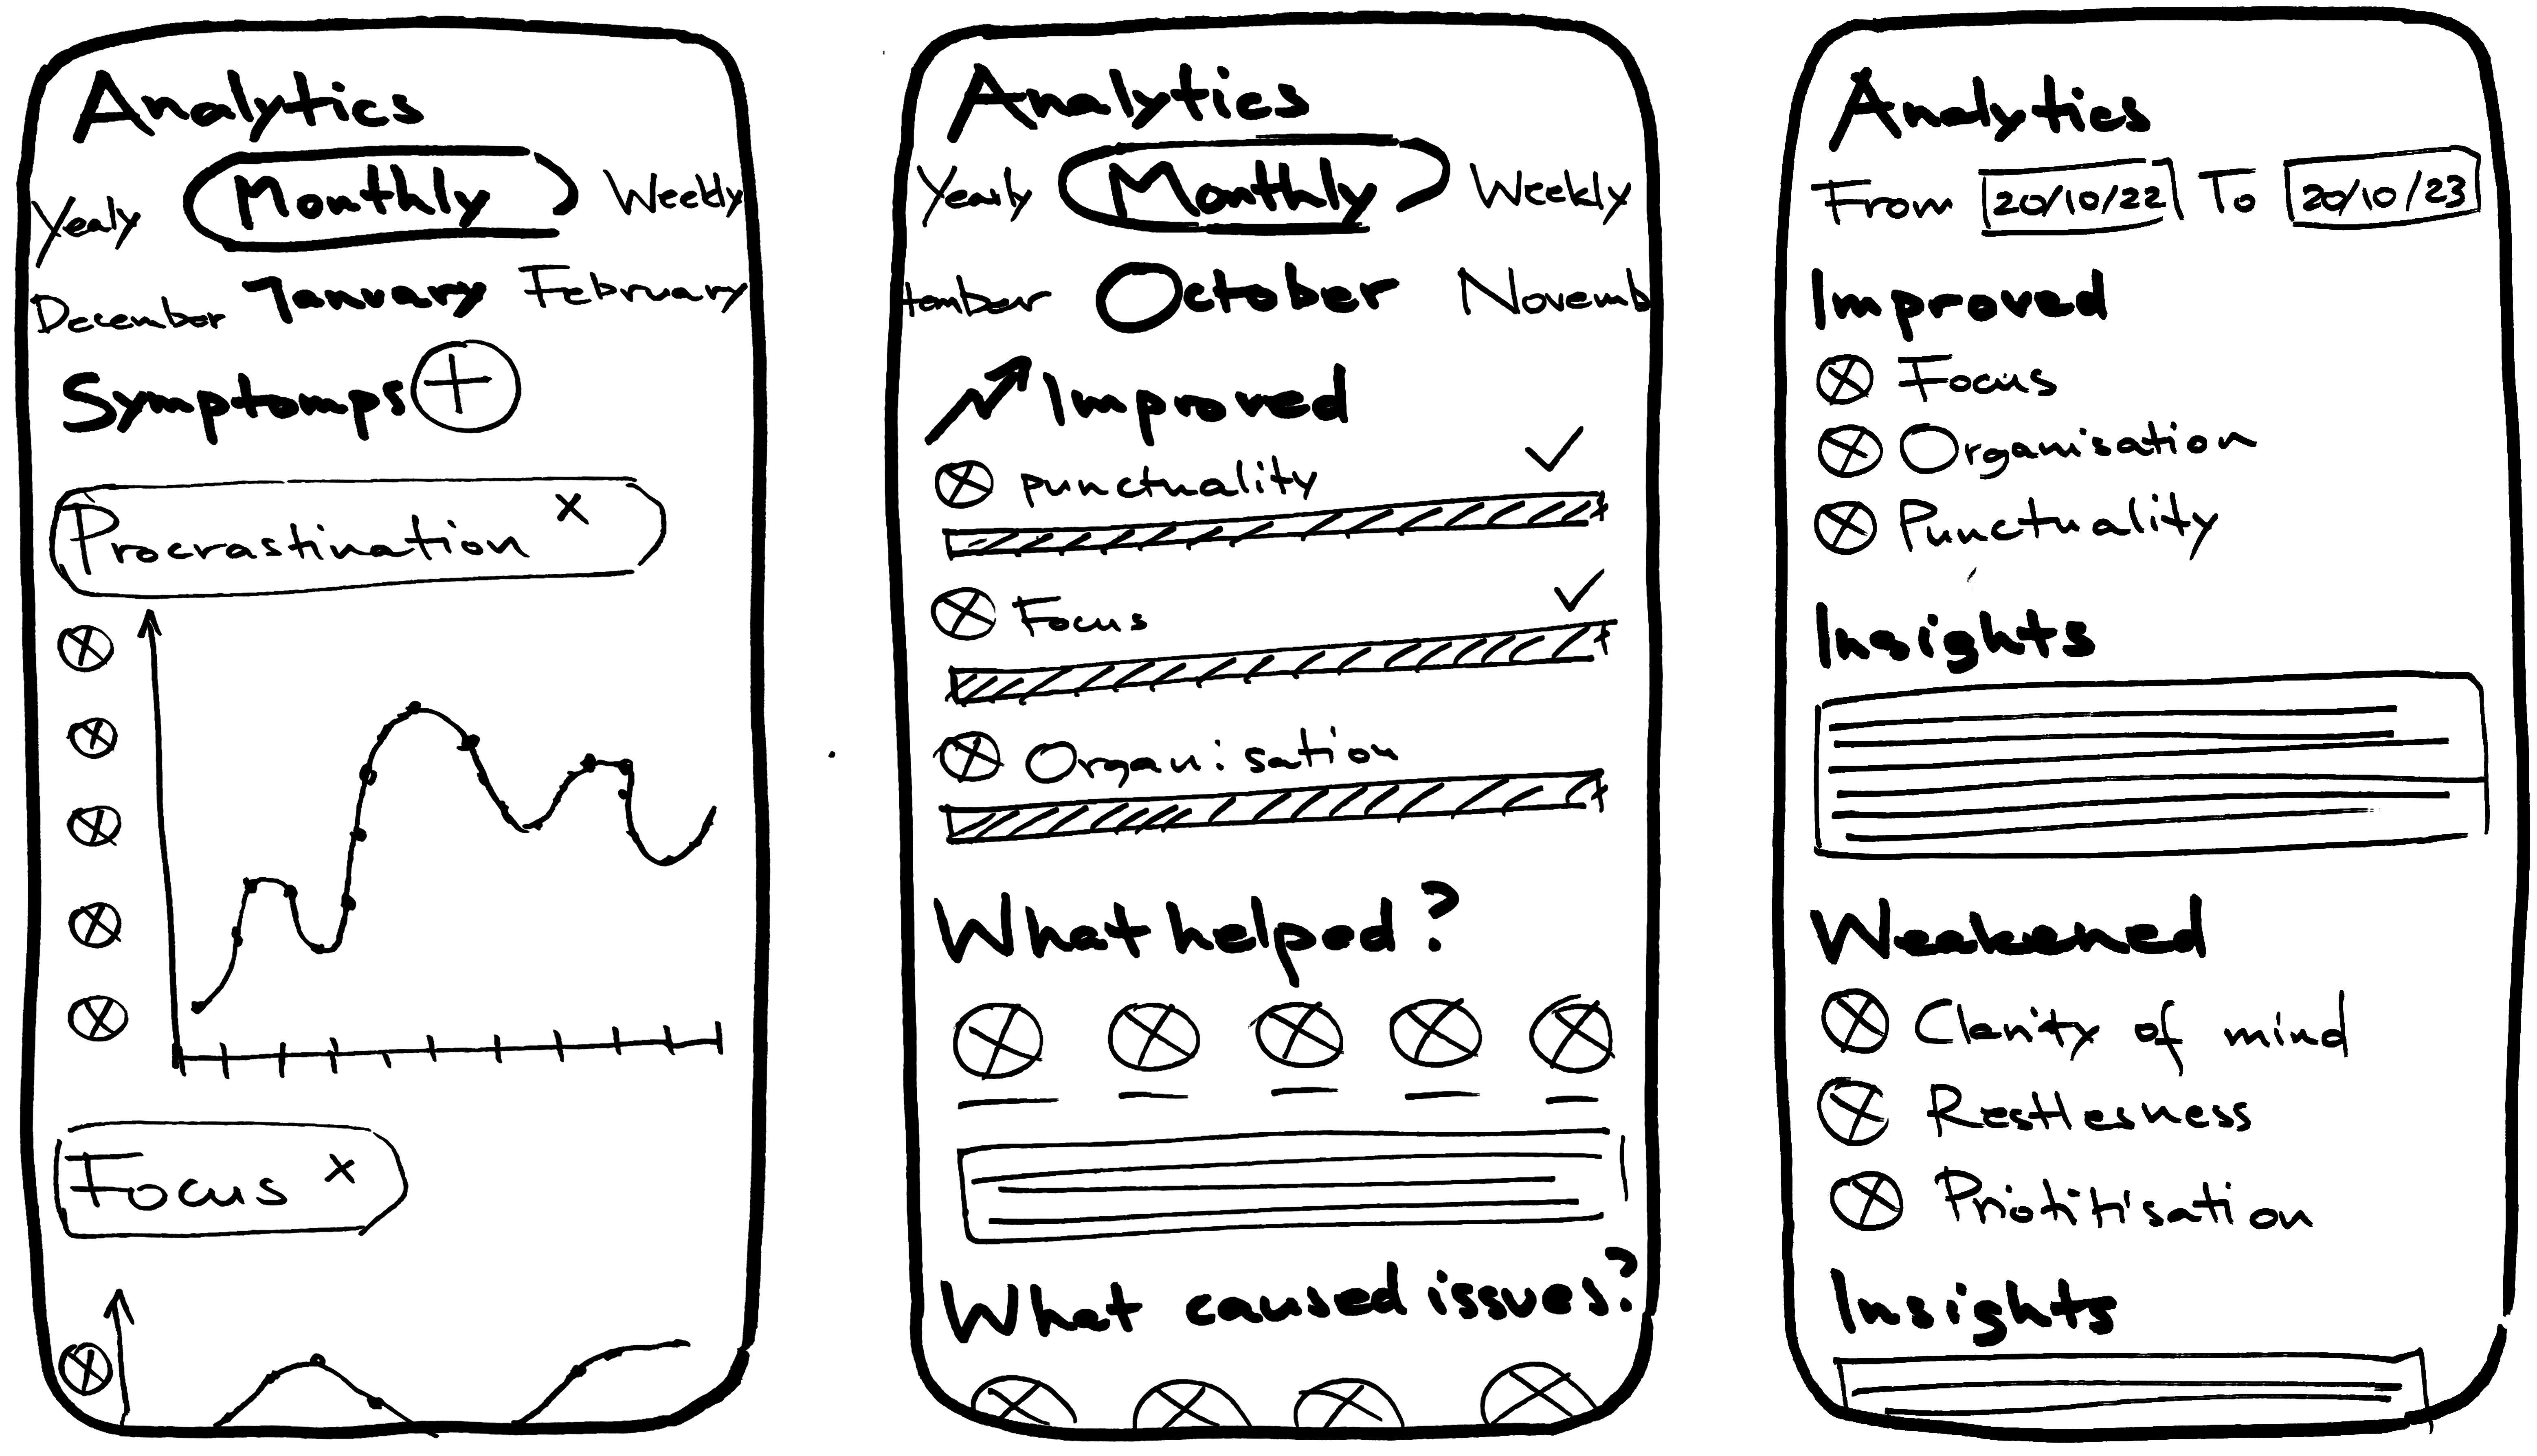
exploratory sketches
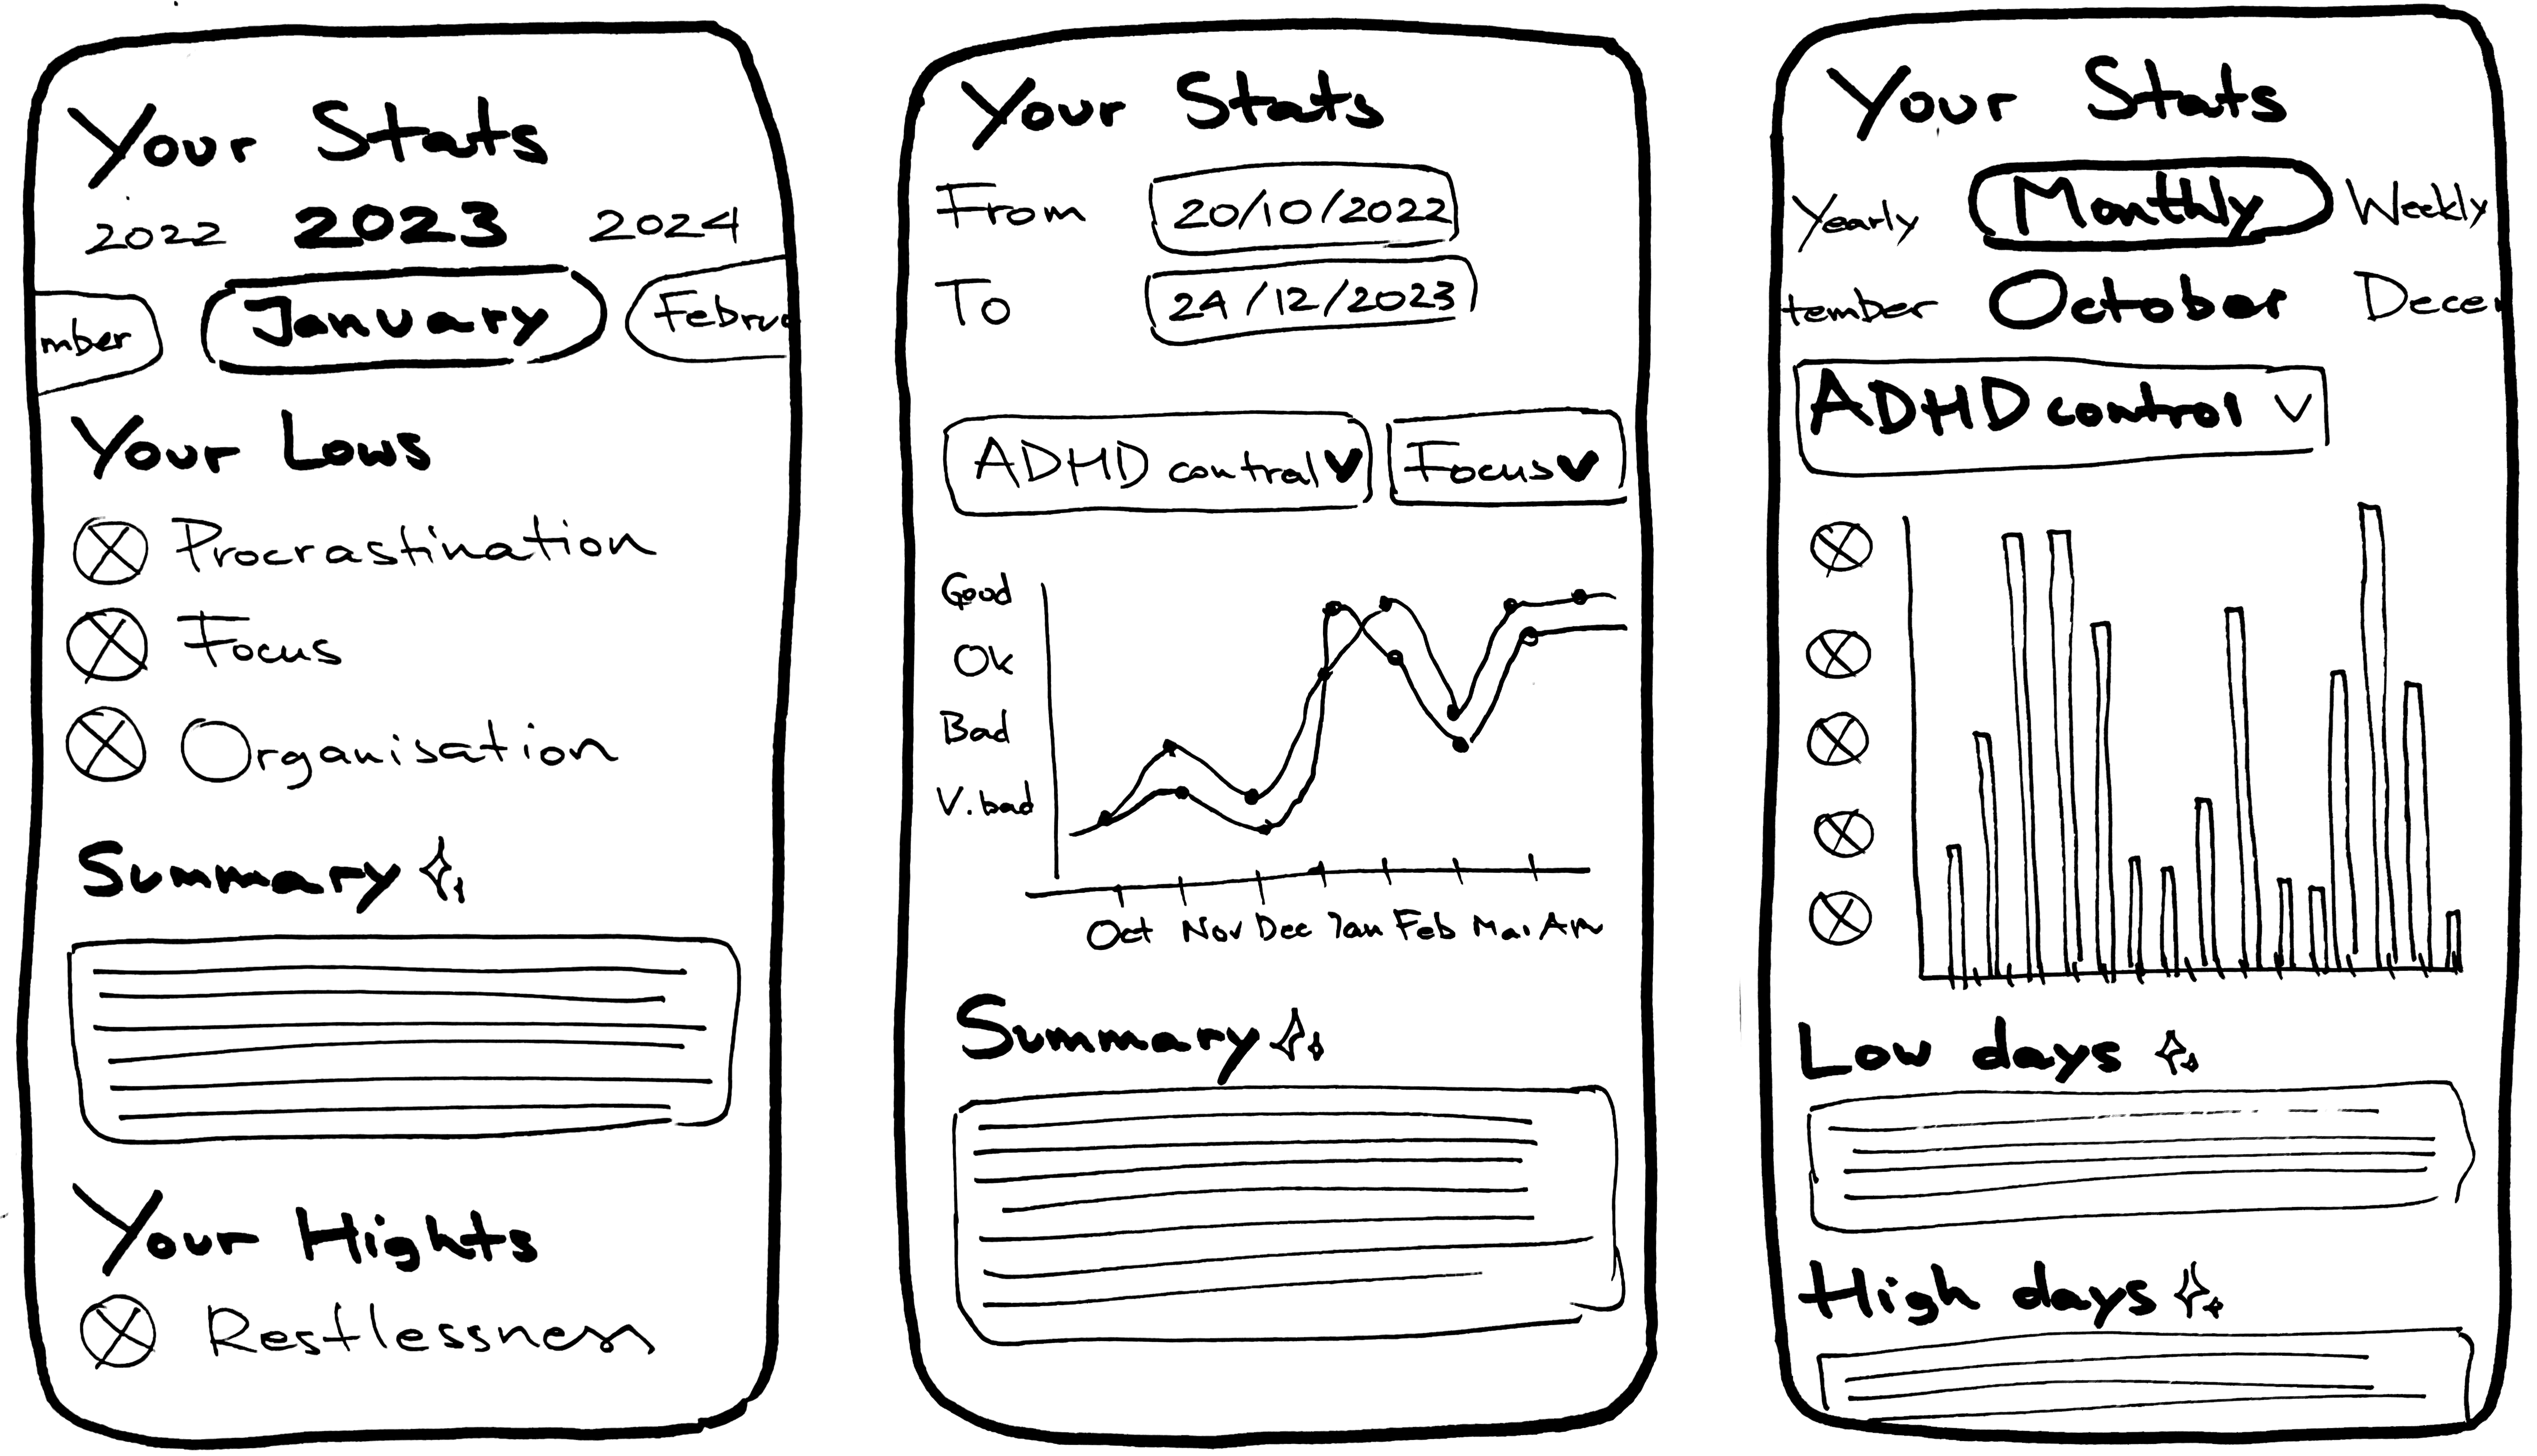
Challenges
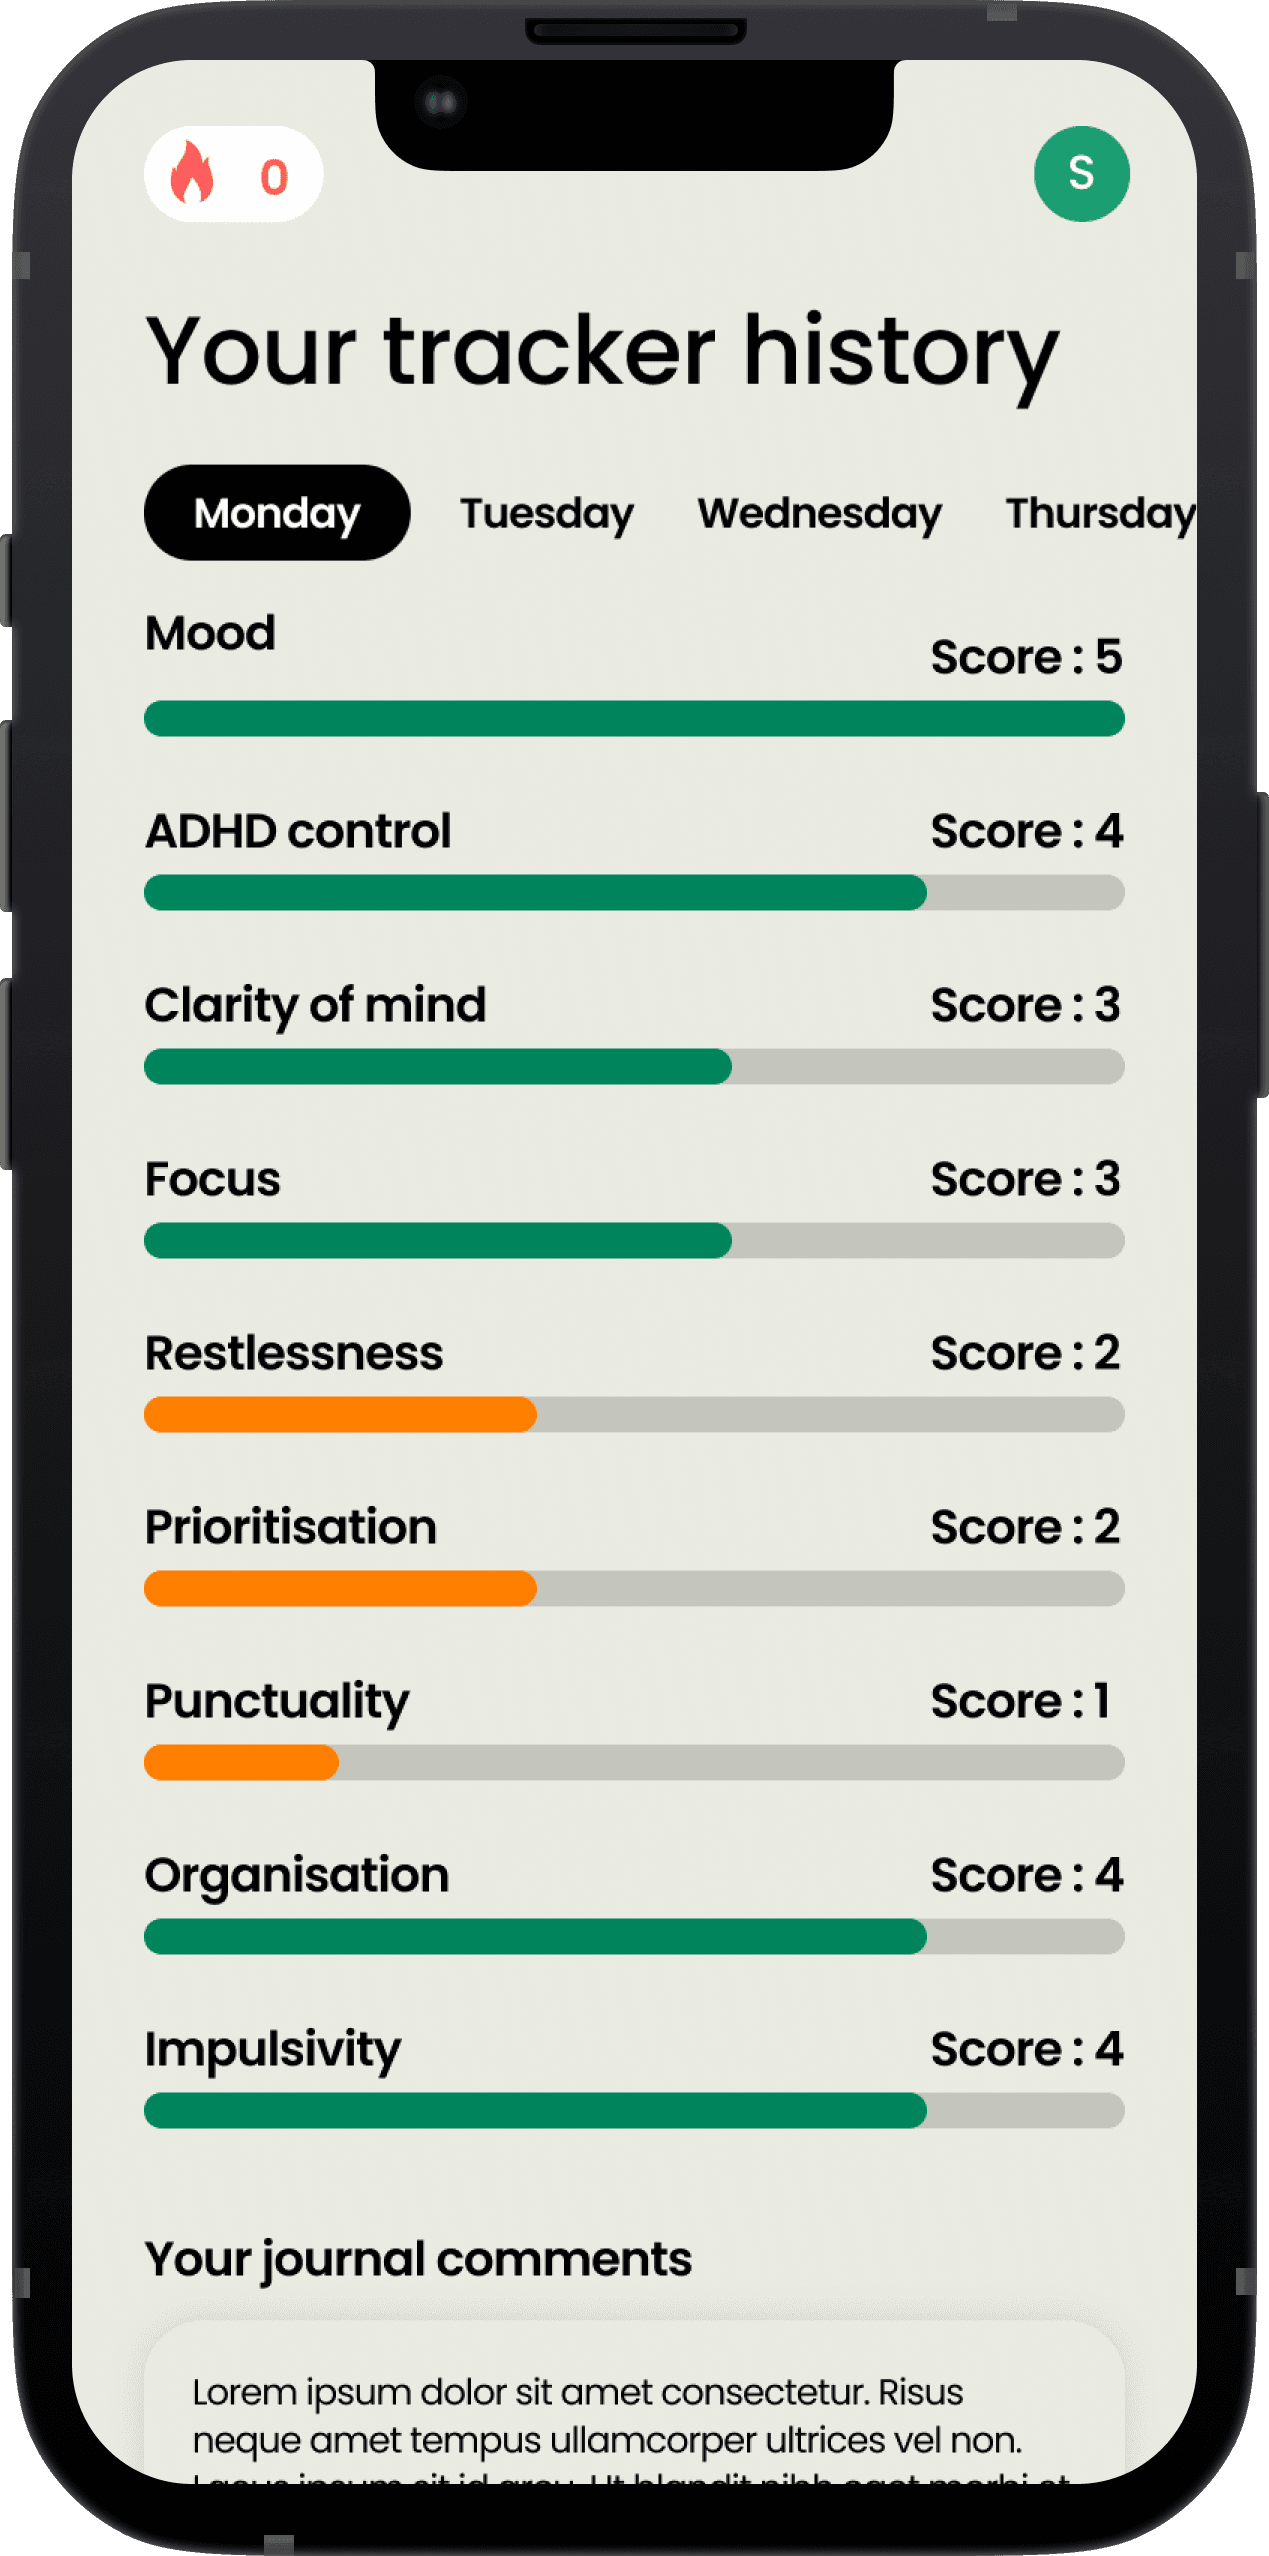
Testing Shows
Information Overload
I started with a day-by-day layout and colour-coded progress bars to help users review their week and spot patterns. But, user testing showed that this layout was overwhelming.

“I’m finding it hard to make sense of all the symptoms and analyse them day by day to see where my low points are.”
Solution
User Journey Shaping Clarity
I focused my redesign on improving the user’s journey when reviewing their check in data. The goal was to help users move seamlessly from identifying key pain points to diving deeper into specific insights.

Katherine Bell
Therapy Client

“How has this week been overall?”

“Which days were the hardest for me?”
“What made those days so challenging?”

“What should I talk to my therapist about?”


weekly overview graph >
I designed a visual representation of the week to help users quickly understand key patterns. At a glance, users can spot the worst days and identify areas to explore further.
two-tab view >
To make navigation easier, I introduced a two-tab system that enables users to switch between a high-level weekly summary and detailed check-in data.
symptom ranking >
To make the data more digestible, I grouped symptoms into categories: highs, lows, and neutrals. This provided clarity and allowed users to focus on what mattered most.
journal and wins entries >
Journals add valuable context by capturing what was happening on specific days, while “wins” serve as positive reinforcement, helping users stay motivated.


In parallel, I also addressed session booking drop-off by introducing a batch booking feature, allowing users to schedule multiple therapy sessions at once.
Results
Small changes, measurable results
The history feature helped both users and therapists find value in reviewing past check-ins, contributing to a noticeable increase in DAU and average time spent.
Separately, after implementing batch session booking, we saw an increase in therapy bookings.

“It's a great starting point, and I'm excited to use it with my clients.”
@Cog clinic therapist
“Being able to spot key highs and lows of the week helps focus therapy sessions on the most relevant issues.”
@Cog clinic therapist“In the past, I struggled to see the point of checking in, but using it to look back at my week is great.”
@Cog clinic customer
“This motivates me to check in more often, as I can use the entries as a conversation starter in therapy.”
@Cog clinic customerKEY TAKEAWAYS
DESIGN IS COMPLEX
AND CONTEXT-DRIVEN

prioritisation
Business goals, budgets, and timelines shape decisions. We prioritised feasible solutions with the highest user value.
communication
Clear communication and early engineer involvement ensured smooth implementation and prevented wasted effort.

iteration
A big vision serves as a north star, but progress comes from iterating in small steps and tracking feedback.

View next project