Turning a manual legacy process into a self-serve product
brand
 E.ON NEXT
role
Research
UX/UI
Prototyping
Delivery
tools
Figma
Miro
Hey Marvin
summary
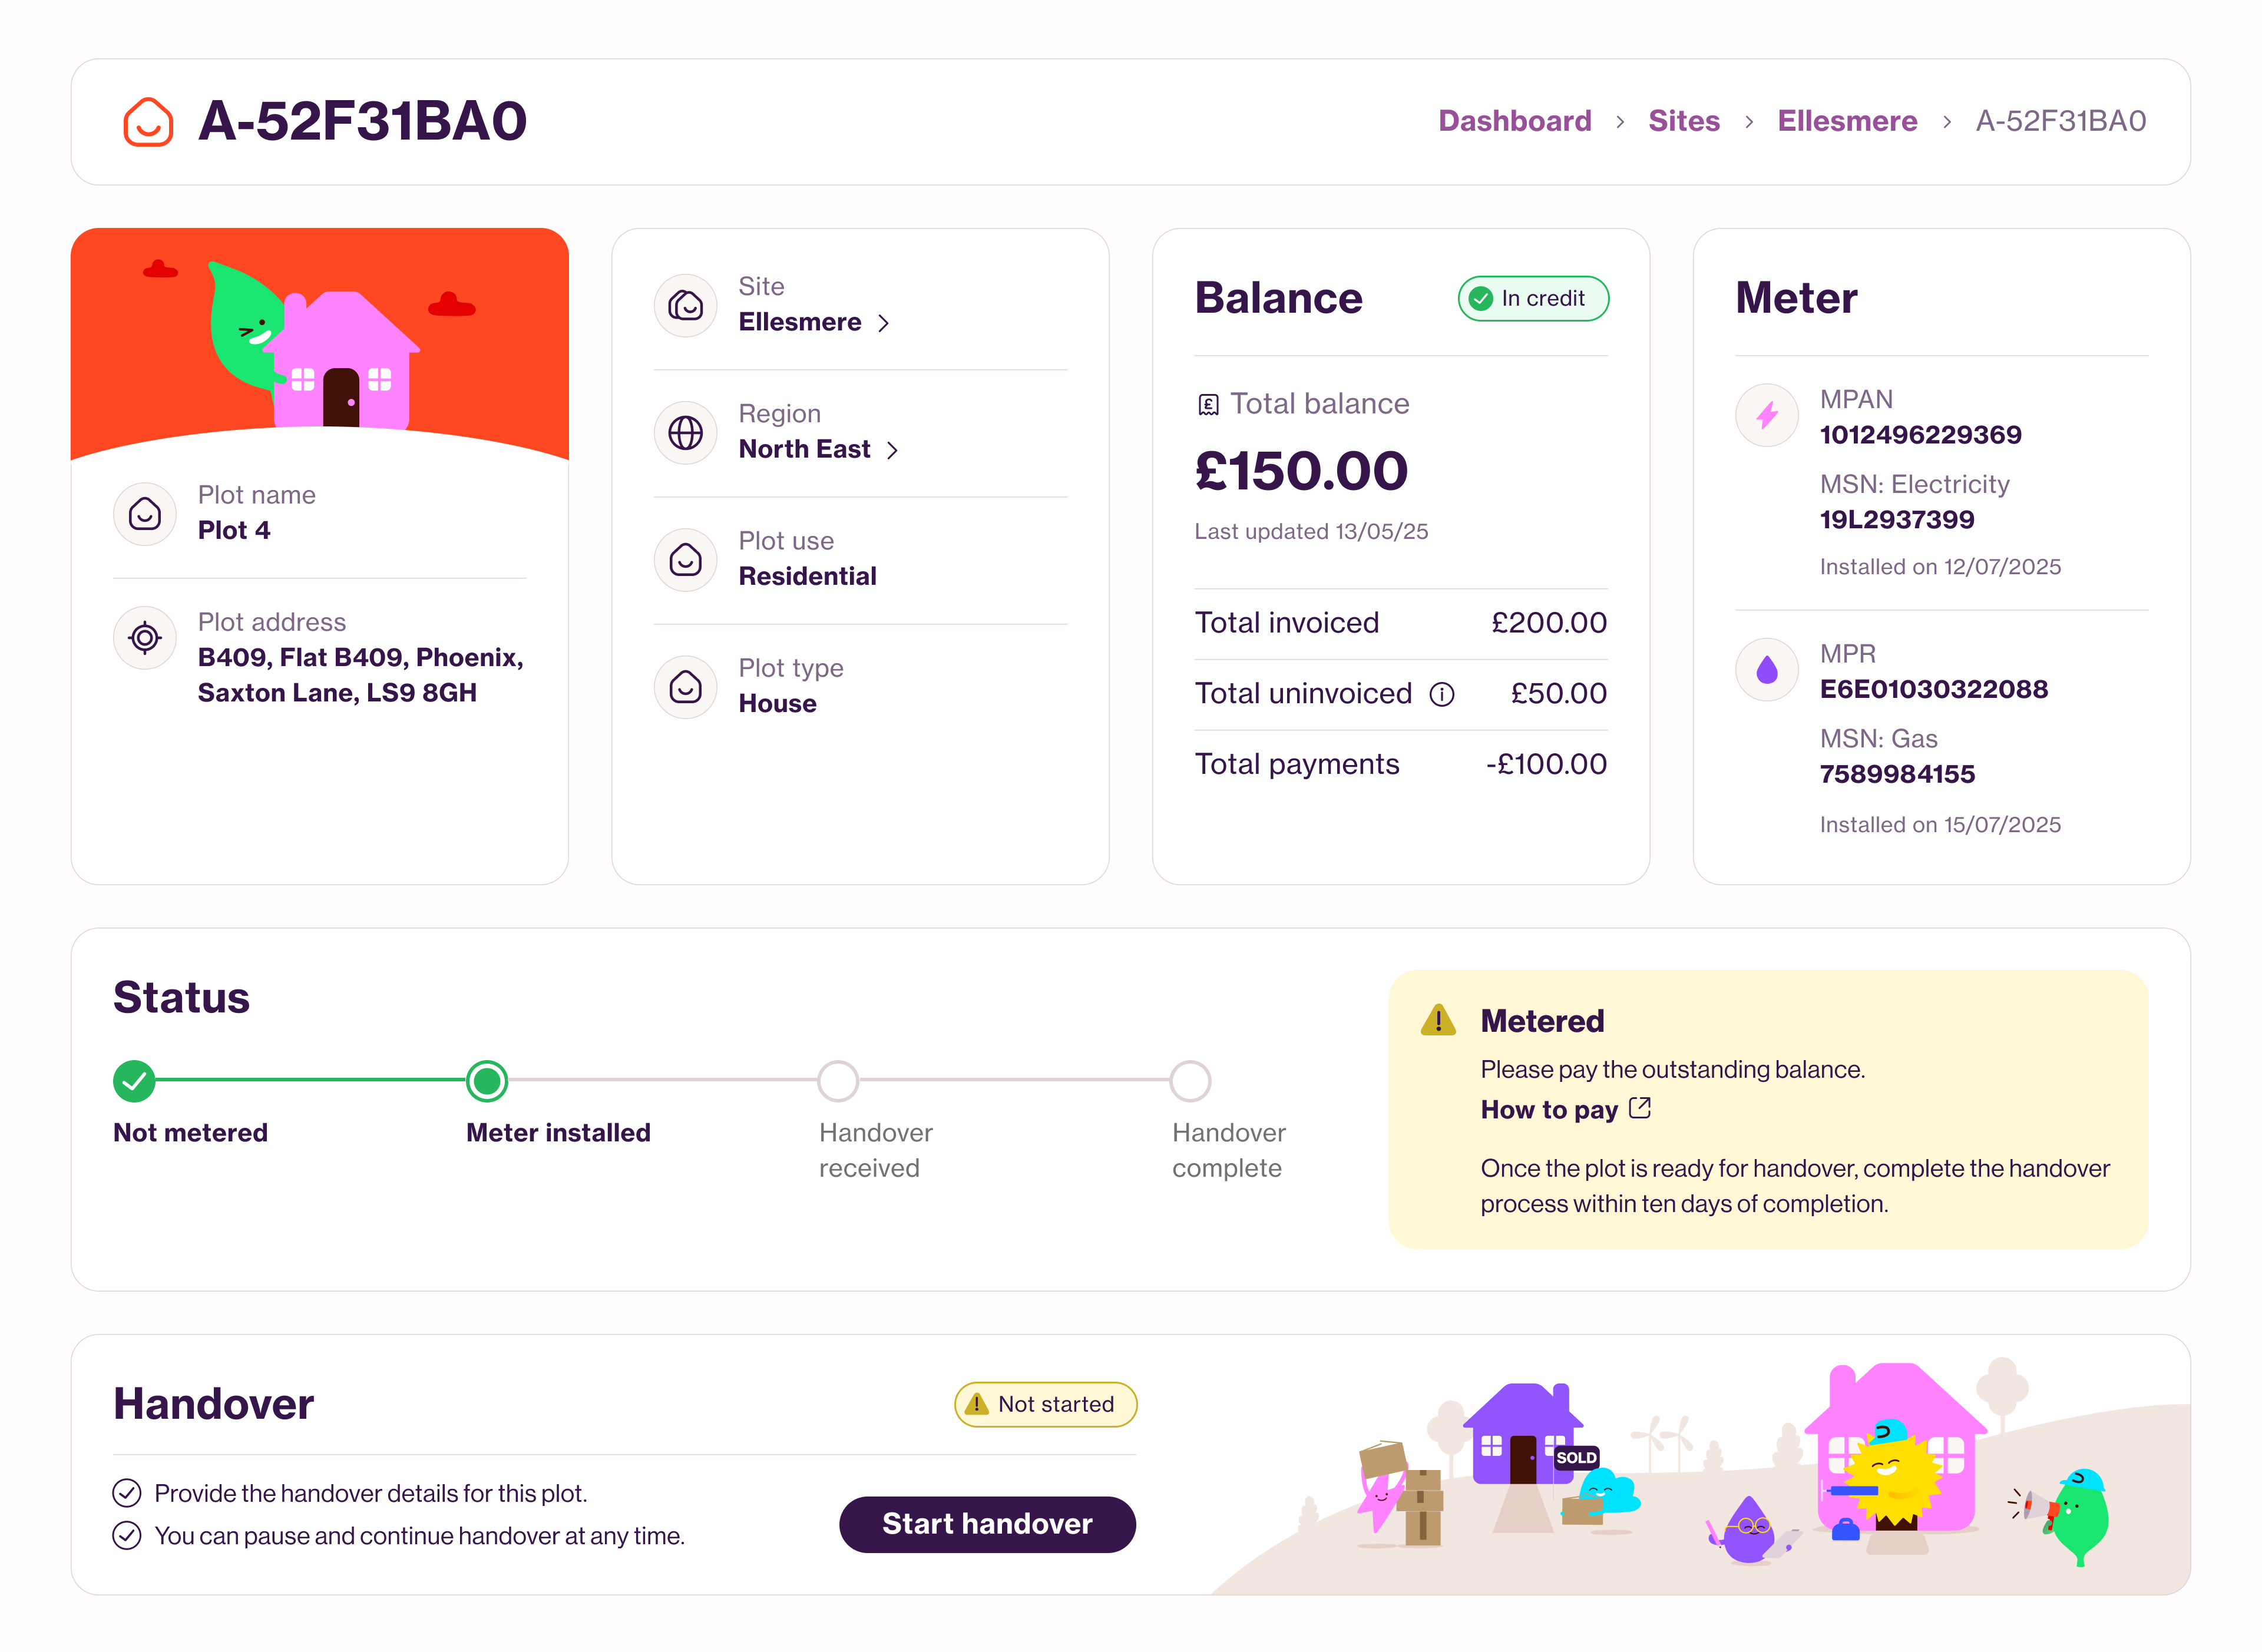
When a new-build home is sold, its developer hands the plot's energy account over to the new owner. I redesigned that journey for E.ON Next, transforming manually submitted Google Sheets into a self-serve product on track to release the £4m handover debt.
setting the stage
Gateway wasn't my project. Its designer left the company with business-critical work pending, so I stepped into a new problem space to help. I built my understanding of the property developer domain by reviewing past research and conducting more interviews, which allowed me to create a user-focused solution.
My role

research >
I interviewed housing developers and ops teams, synthesised the research, and ran two rounds of testing.

design >
I designed the end-to-end flows within E.ON Next's design system, expanding it where the product needed new patterns.

prototyping >
I wireframed the main screens for stakeholder alignment and used AI to build a interactive prototype for user testing.

delivery >
I documented all designs, and now collaborate closely with the engineers, reviewing the work on each feature.
starting the project
Hit the ground running
Gateway's scope was wider when I joined. Handovers were one avenue, disputes another, and no decision on where to start. I got up to speed on both problem spaces, then took them into my interviews with internal ops and property developers so I could size them up.
I started ideating for each. Disputes kept raising questions. They needed more supporting features to succeed. Handovers was where monetary value was locked.
I evaluated both directions and prioritised where design could bring value fastest. Within a couple of weeks I convinced ops to build around handovers first.

AI workflows
Accelerate under pressure
miro ai
Synthesise the boards
Miro AI helped me synthesise the inherited boards' content and get up to speed with research.
notebooklm
Query every transcript
Loading all the interview transcripts into NotebookLM and querying it filled in the gaps.
figma make
Generate quick ideas
Figma Make allowed for generating quick ideas that could be refined or discarded.
problem space
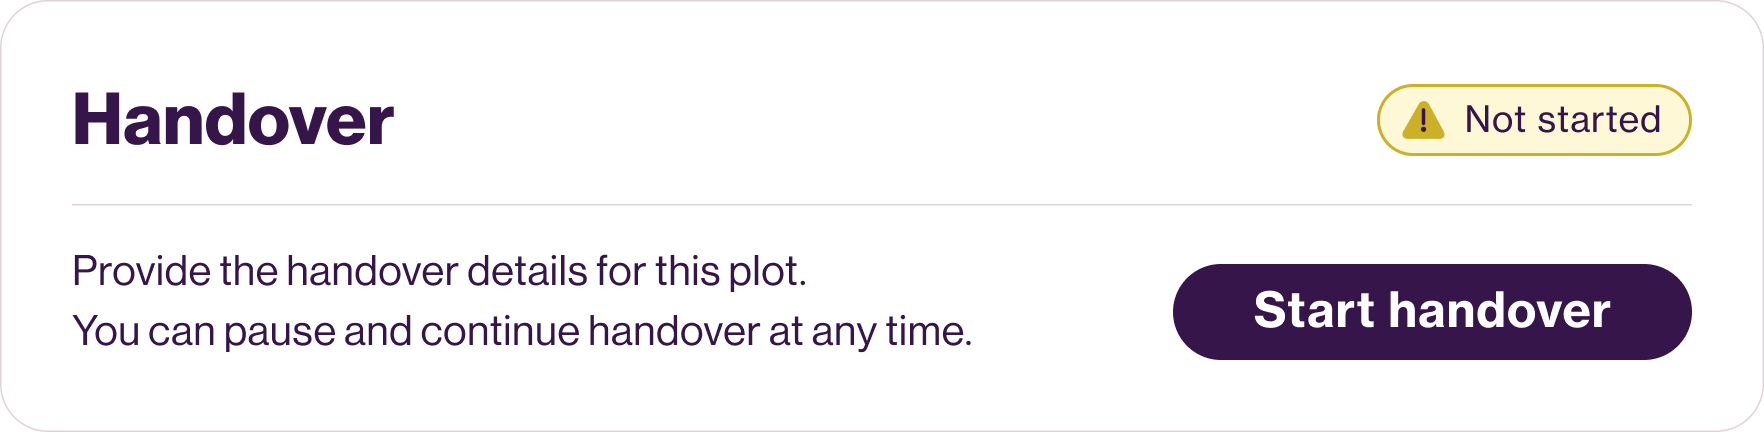
Handovers lived in a spreadsheet
stage #01
Plot sold
A new-build home is sold. The developer needs to hand the plot's energy account over to the new owner.
stage #02
Spreadsheet
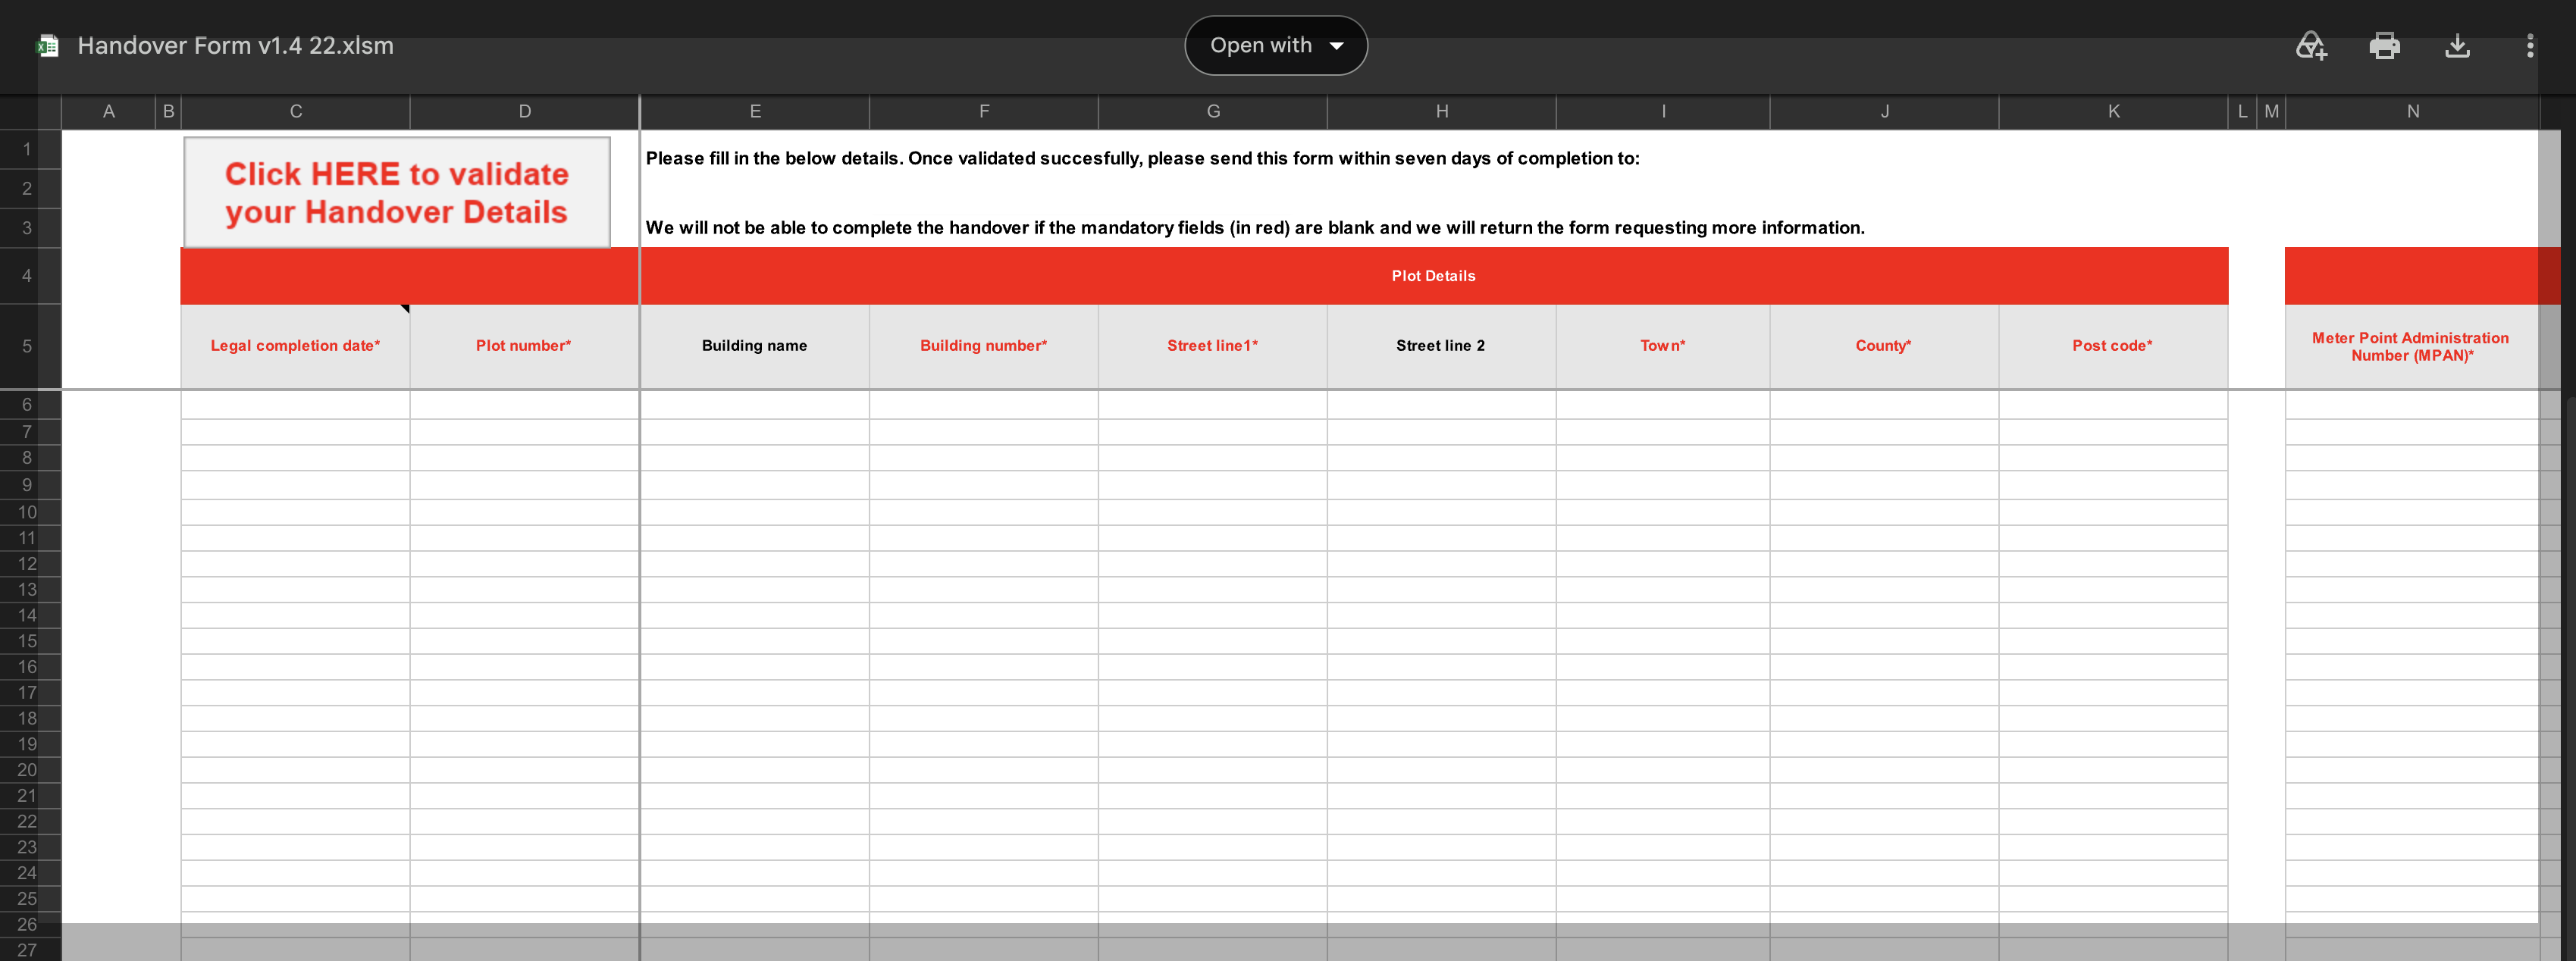
The handover reaches E.ON Next as a manually filled spreadsheet. Nothing is validated on the way in.
stage #03
back and forth
Missing fields, typos and mismatched details bounce between ops and the developer over email.
stage #04
The stall
With no central place to track it, a handover still waiting on information gets forgotten in a flooded inbox.
the fallout
Debt build
The plot stays in the developer's name. The new owner can't set up an account, unbilled energy turns into debt.
4 million pounds of the Smart New Connections debt book is tied to customers waiting on a handover.
research
The handover process from every side

smaller developers
Housebuilders selling a few plots at a time, handling handovers themselves.

bigger developers
Large-scale developers whose teams submit and track handovers in volume.

internal ops
The E.ON Next operations teams that receive and process every handover.
My goal was to understand how each group actually processes a handover, so Gateway could fit the way they already work.
key research findings
Developers need a centralised view,
but they don't all work the same way
insight 01
Different workflows
Smaller developers hand over the moment a plot sells. Bigger developers batch theirs weekly through a spreadsheet. One rigid flow was never going to fit both.
insight 02
Lack of visibility
With no centralised space to track a handover's state, developers lost sight of the ones still waiting on information from them.
insight 03
Access restrictions
In bigger firms, the people who process handovers must not have access to financial data. Gateway handles developer invoicing, so access had to be designed in.
design
Every workflow, full visibility,
the right access
how I approached design
I rapidly ideated with AI to decide on a direction.
I detailed key screens to pick up backend and ops conversations.
With AI I created an interactive prototype to put in front of users asap.
single handover flow >
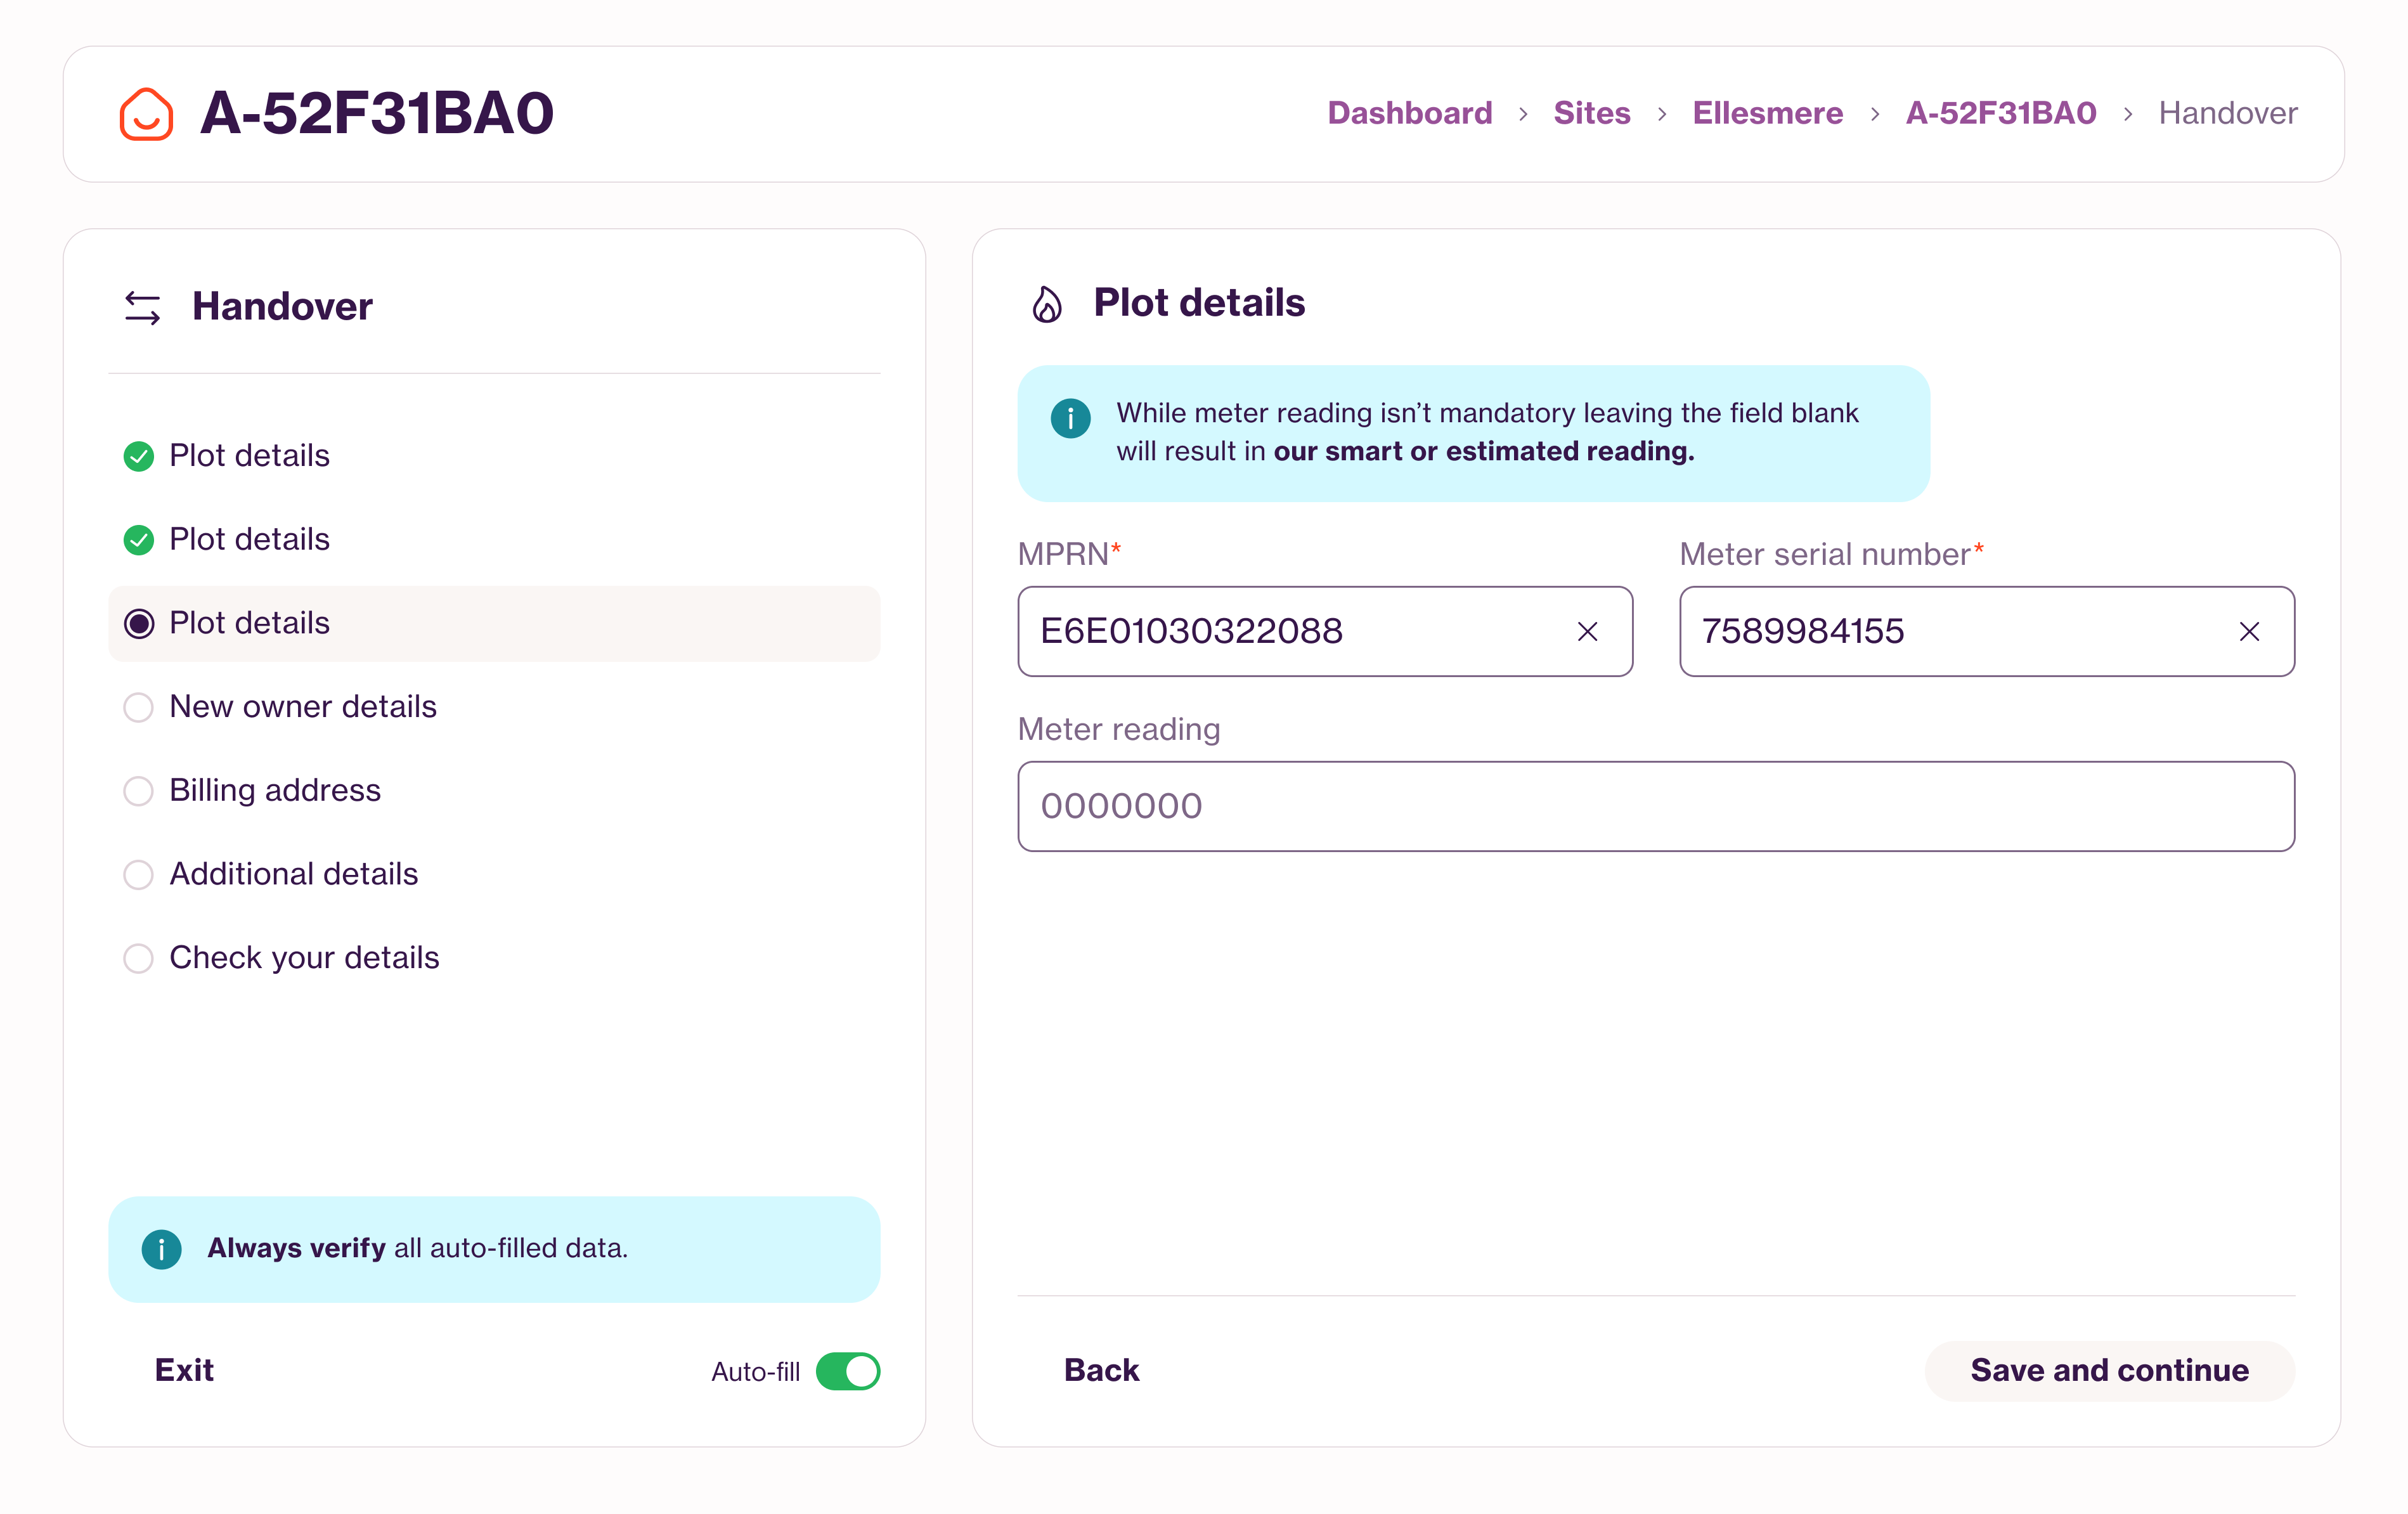
A guided flow replaces the spreadsheet. Developers can leave and come back to their saved changes.
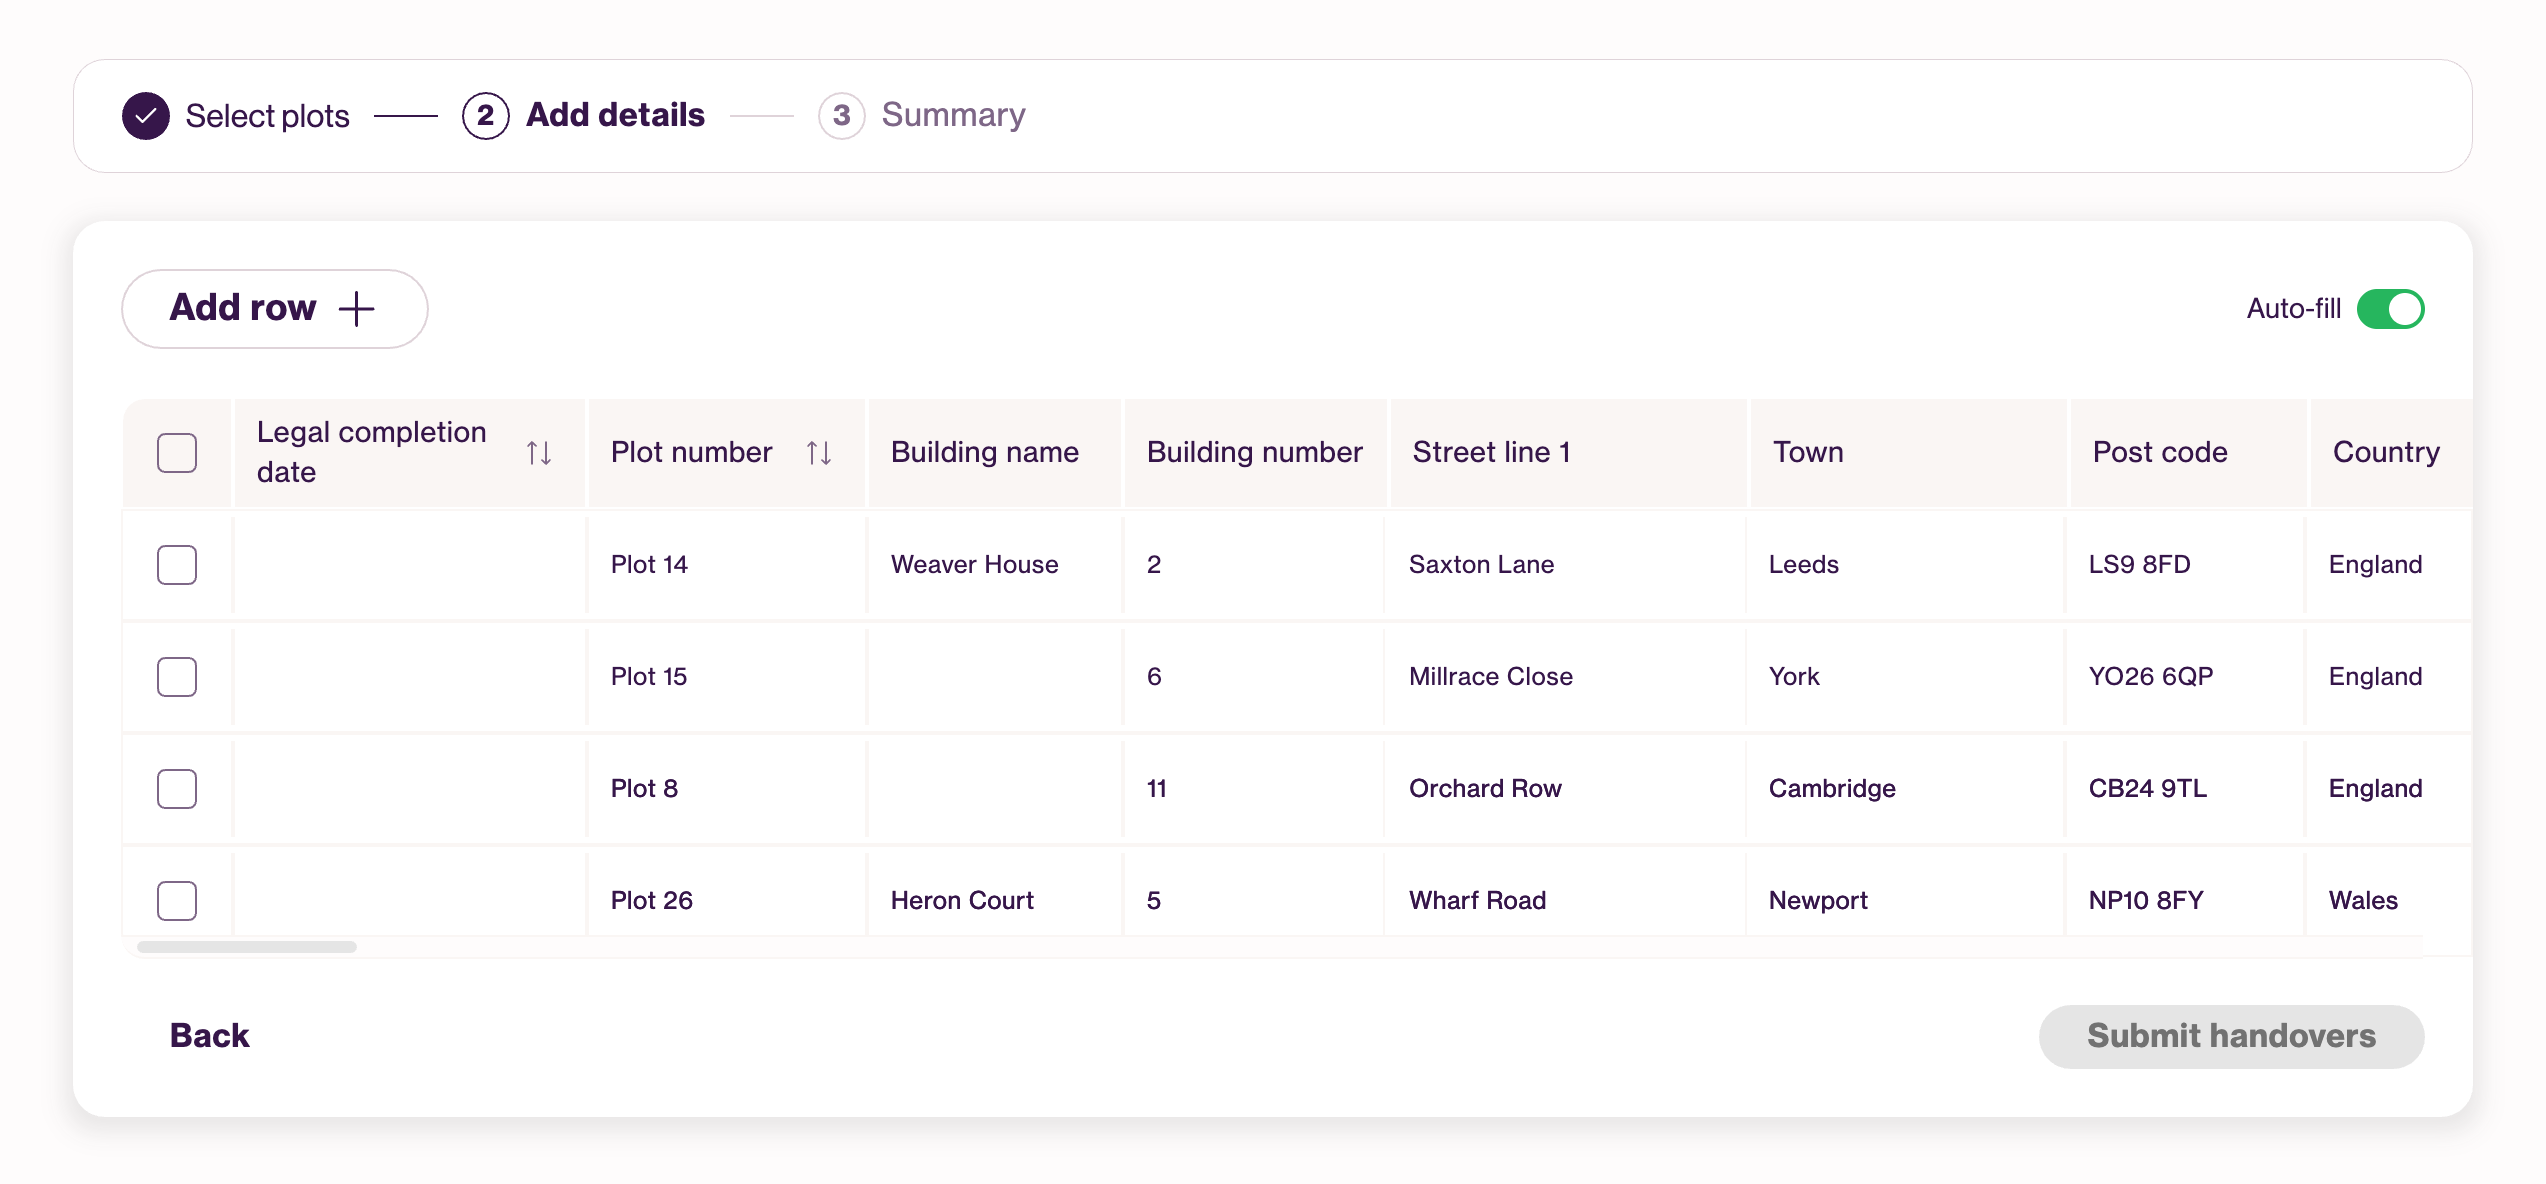
autofill toggle >
In research, prefilled data split the room, some developers loved it and some were firmly against it. So autofill is a toggle.
validation checks >
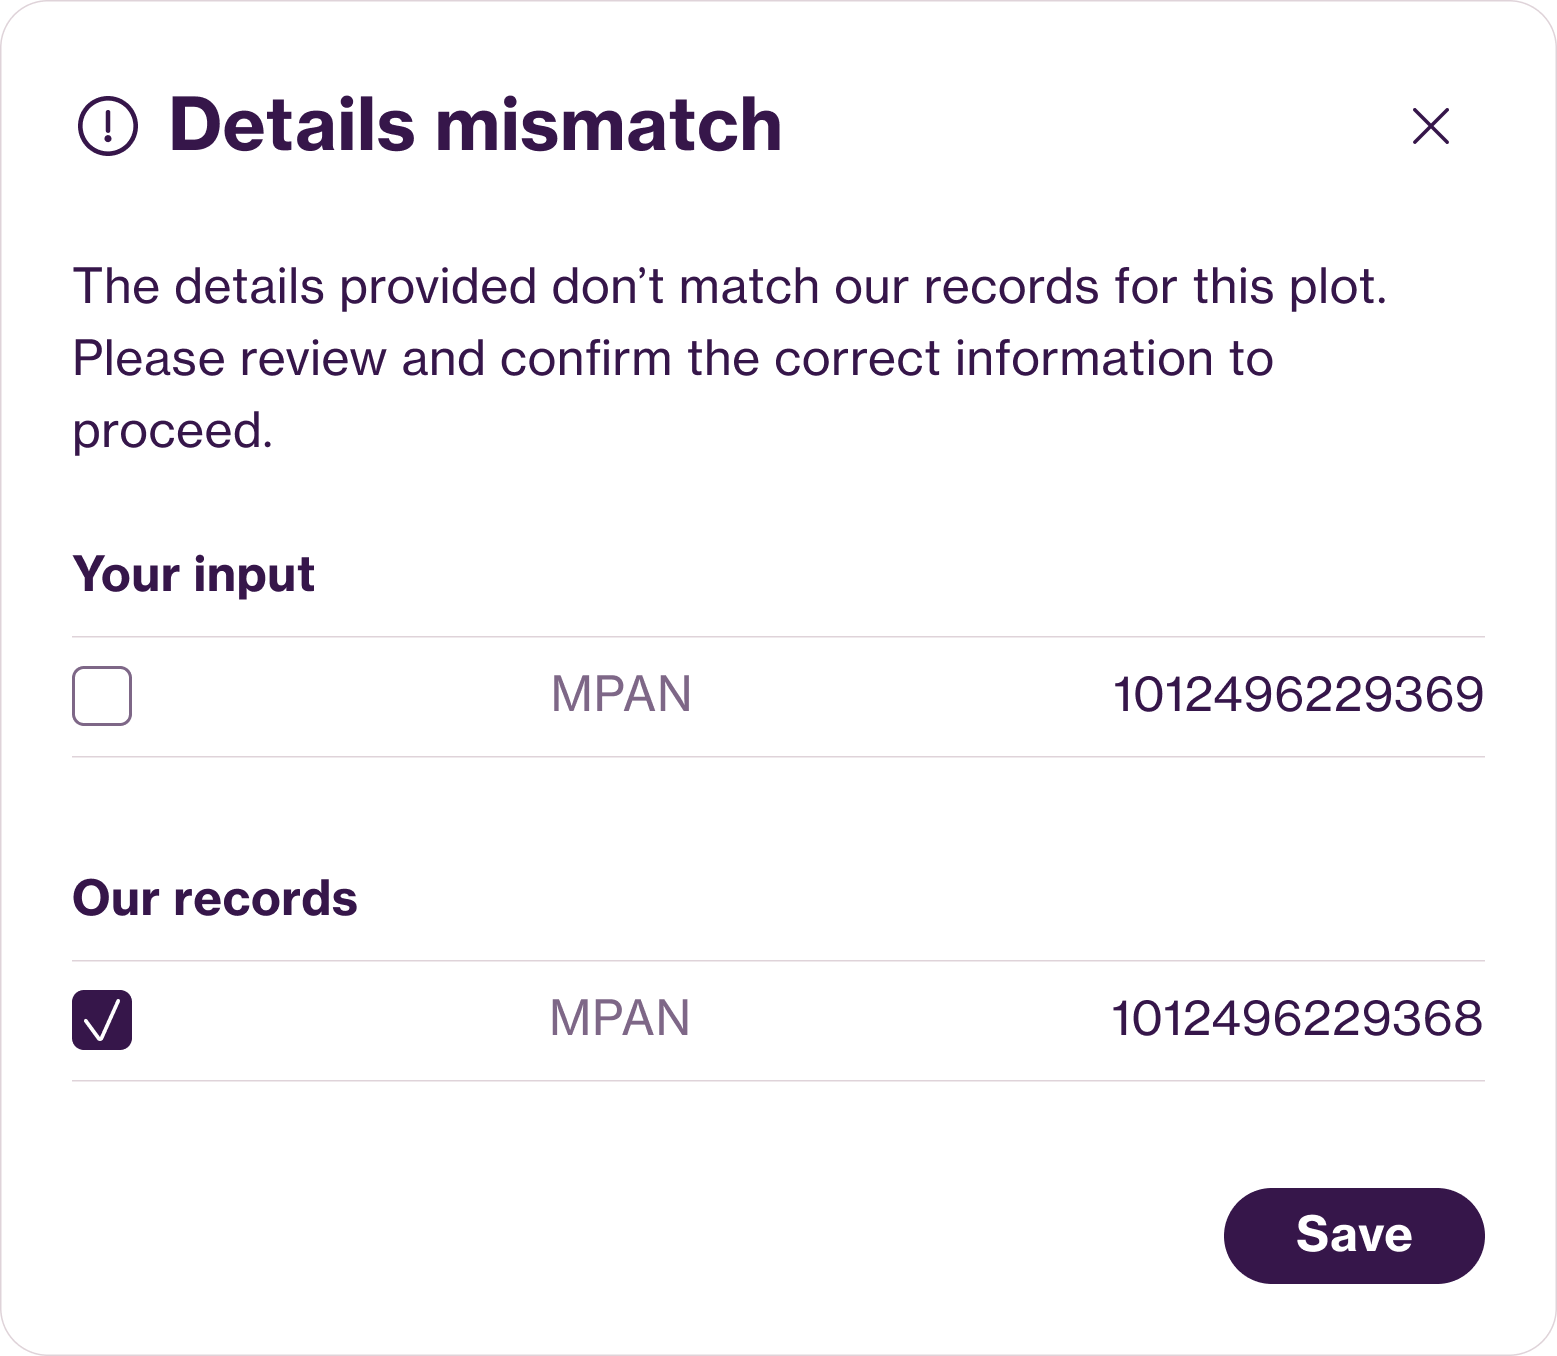
Mandatory fields and validation keep submissions complete, and entries are checked against E.ON Next records. Mismatches get highlighted on the spot, catching the typos that used to slip through.
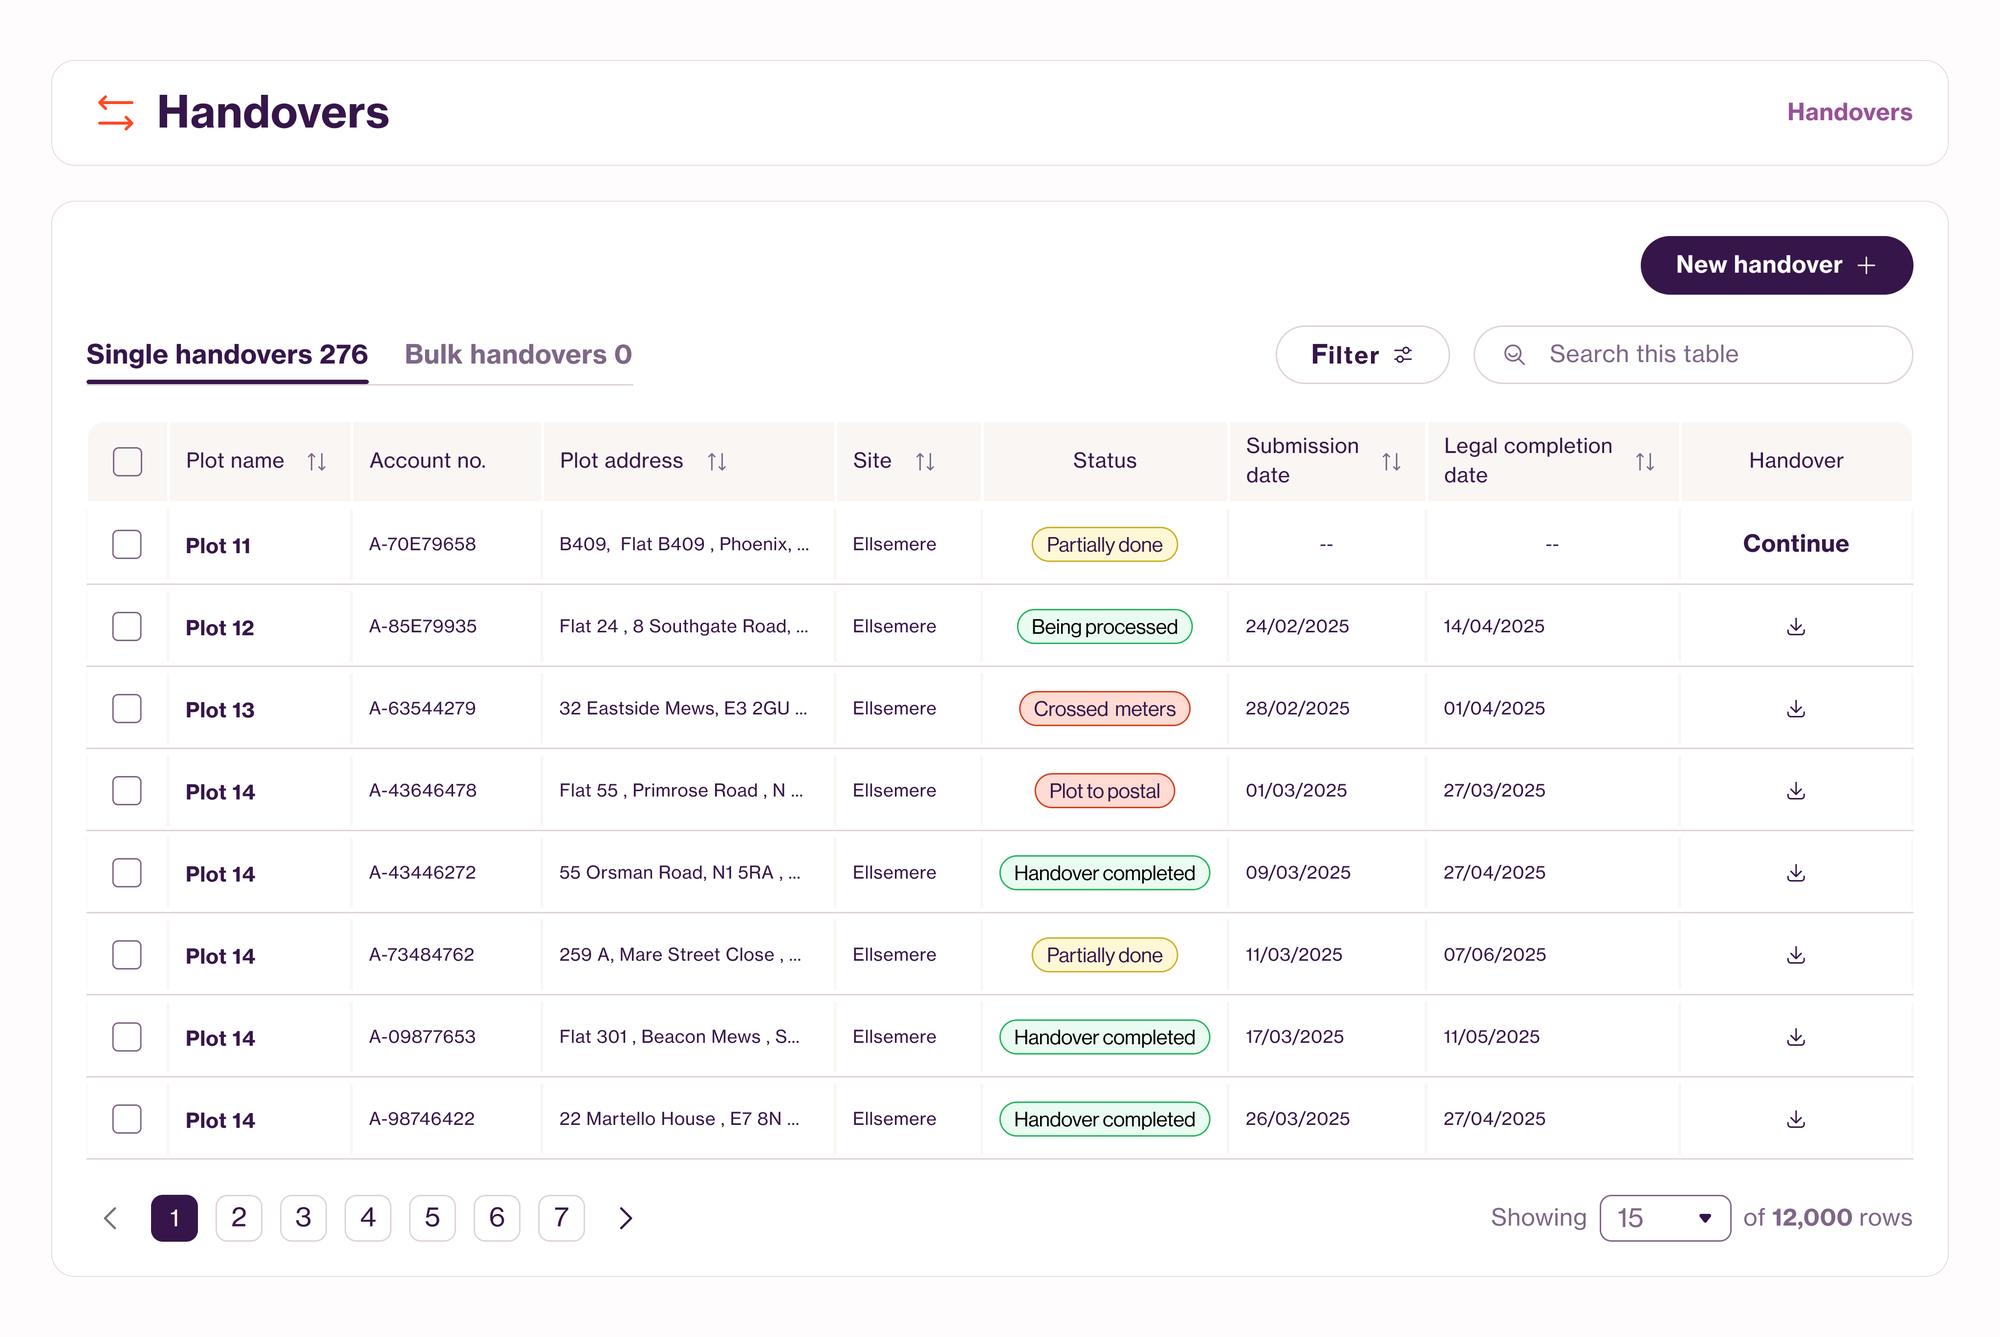
the handovers hub >
Every handover and its status in one place allowing for full visibility.
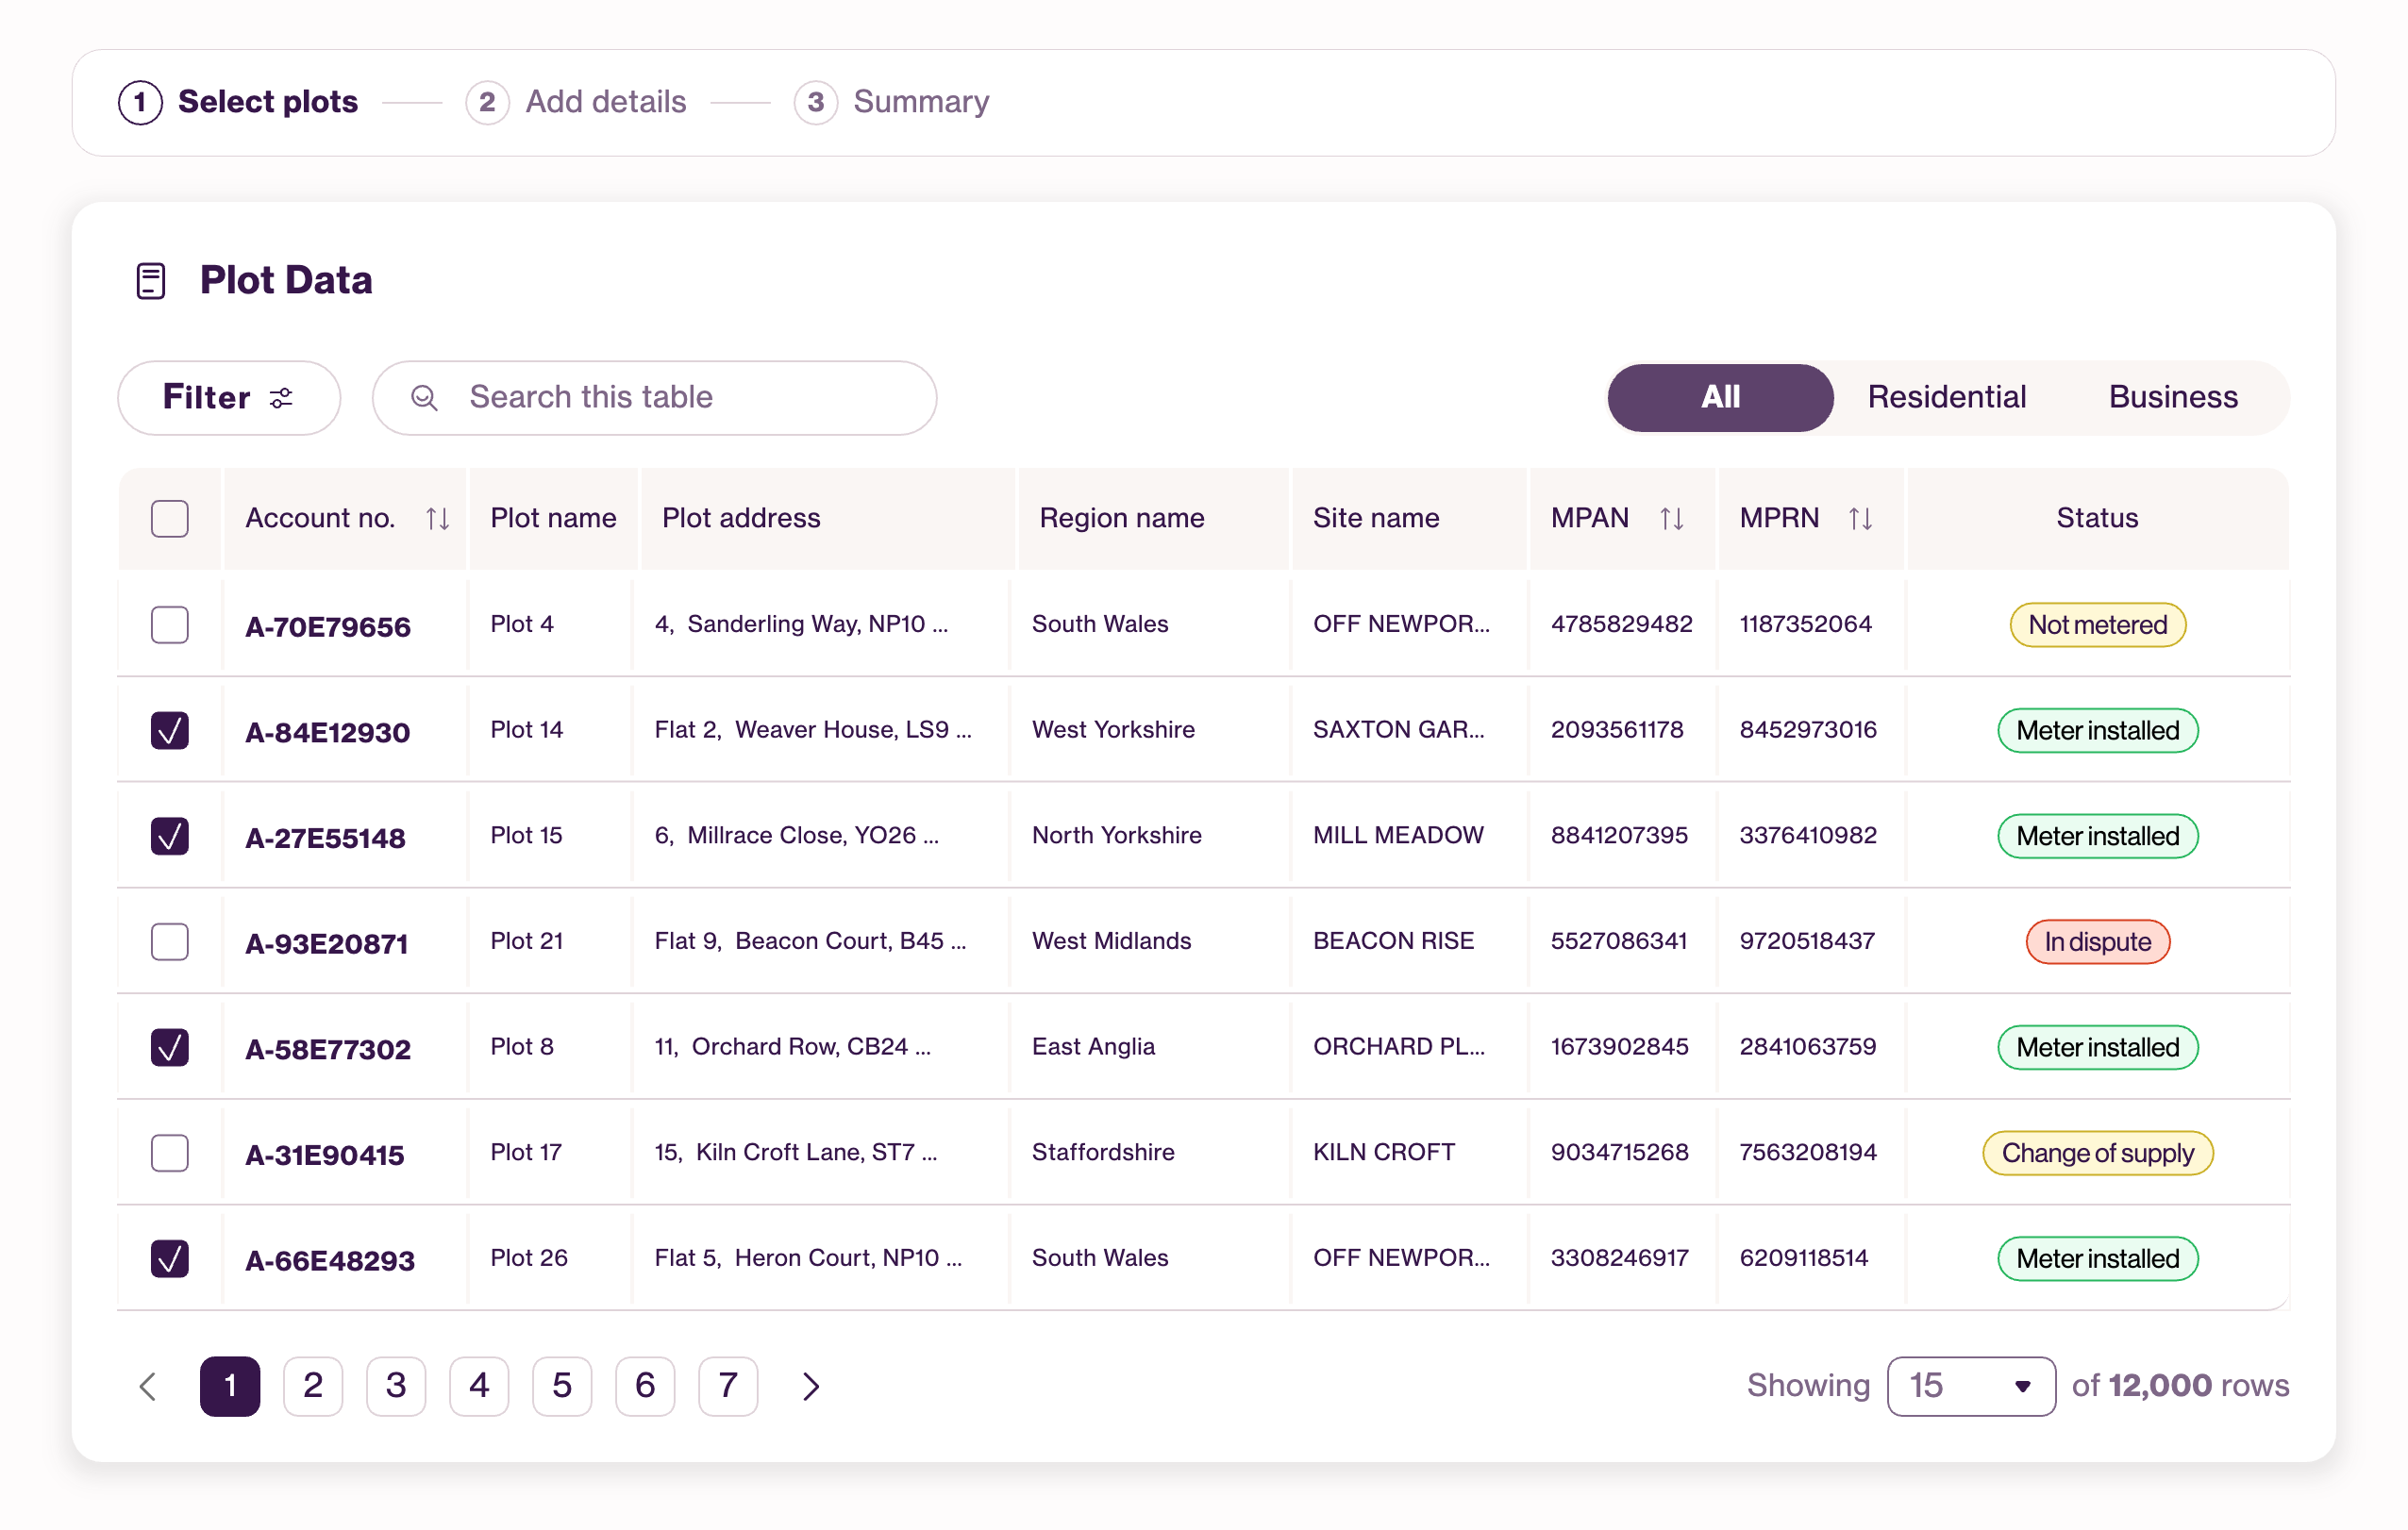
batch table >
Bigger developers pick the plots they want to hand over and complete them in a familiar spreadsheet-style table inside Gateway.
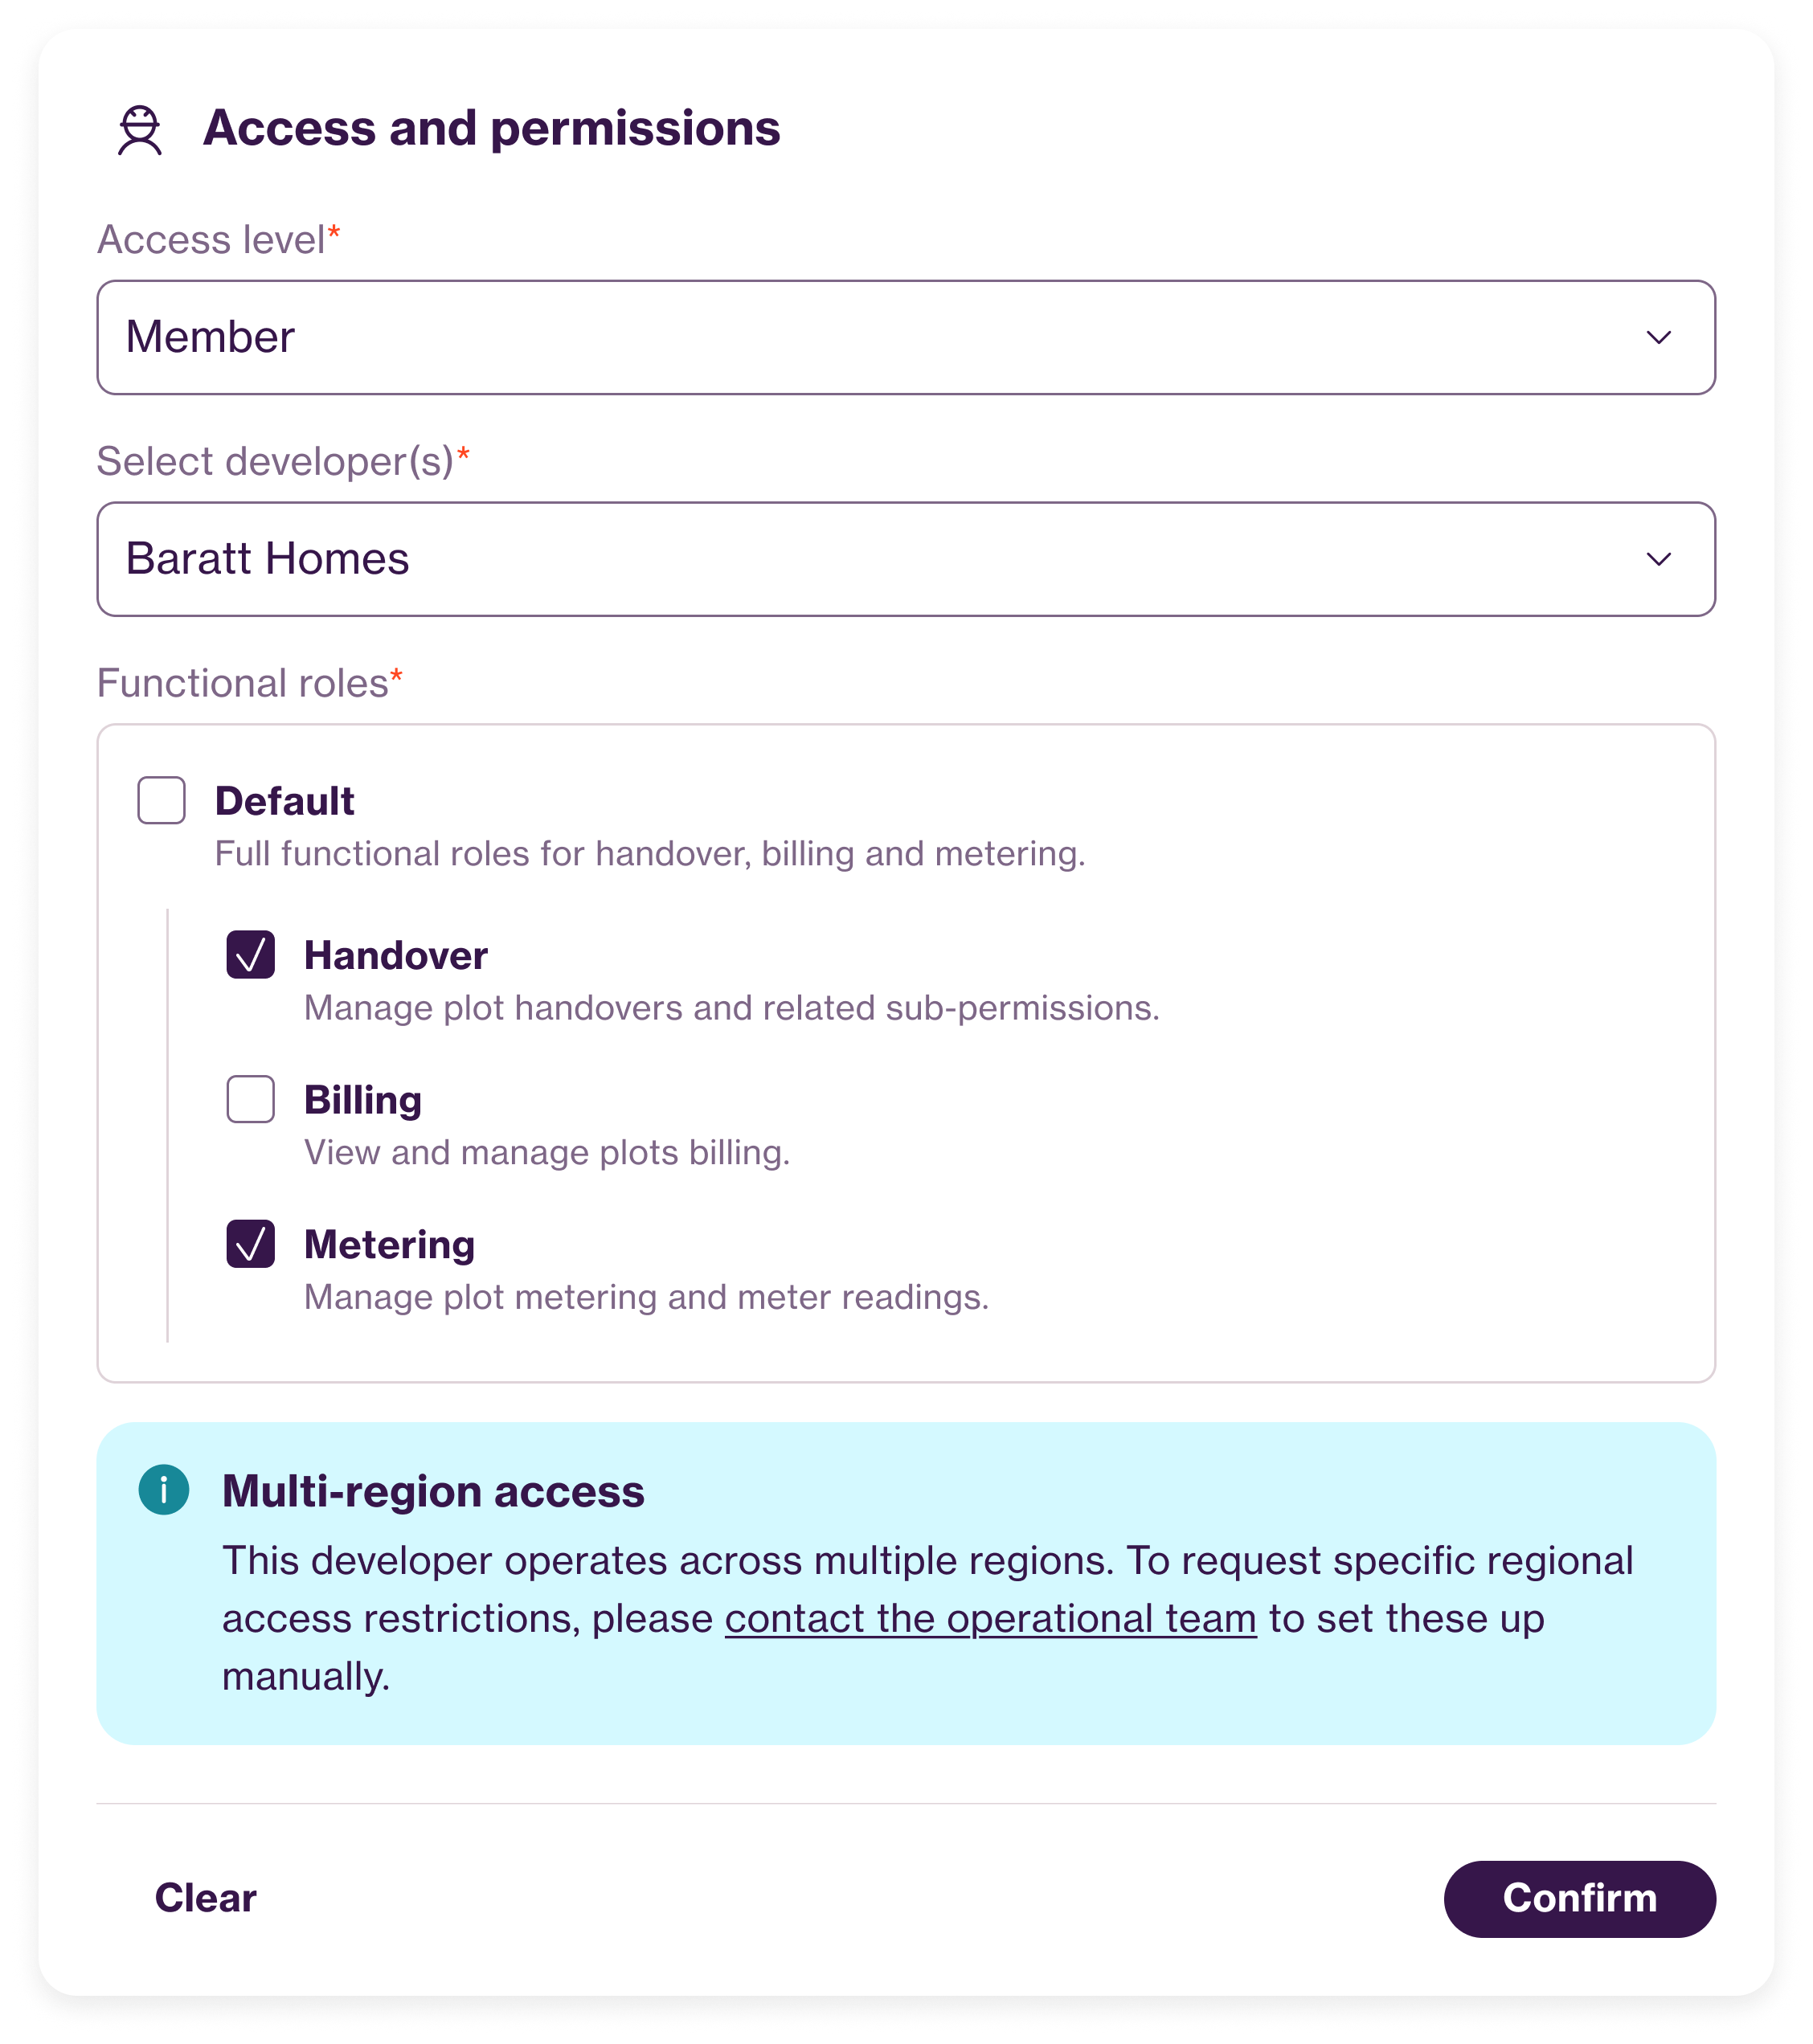
access >
I introduced permission roles so team members can work on handovers without being exposed to financial data.
Restricting access by region is a rare need, so for now that journey runs manually through the ops team while we gauge demand.
testing
Rave reviews from smaller developers,
more work from the bigger ones
The single flow and the hub landed instantly with smaller developers. Bigger ones saw the value but pushed back. Their teams have lived in the spreadsheet for years, and moving onto something new felt riskier than keeping old ways.


“The fact that it would flag it up at this stage means you can query it before we even complete the handover, rather than going through potentially weeks and months of trying to sort out any mismatched data.”
@Property developer

“The Excel spreadsheet is very clunky to use, it feels outdated. This just feels like a much smoother, easier way of doing it.”
@Property developer

“I think it looks quite simple. That's exactly what I was thinking. What you've got there was what I had in my mind already.”
@Property developer

“Some of our people have used that spreadsheet for years. Digitising is the right idea, but force it on them straight away and you'll cause more chaos than good.”
@Property developerupdated designs
Findings highlighted the need
for an interim design
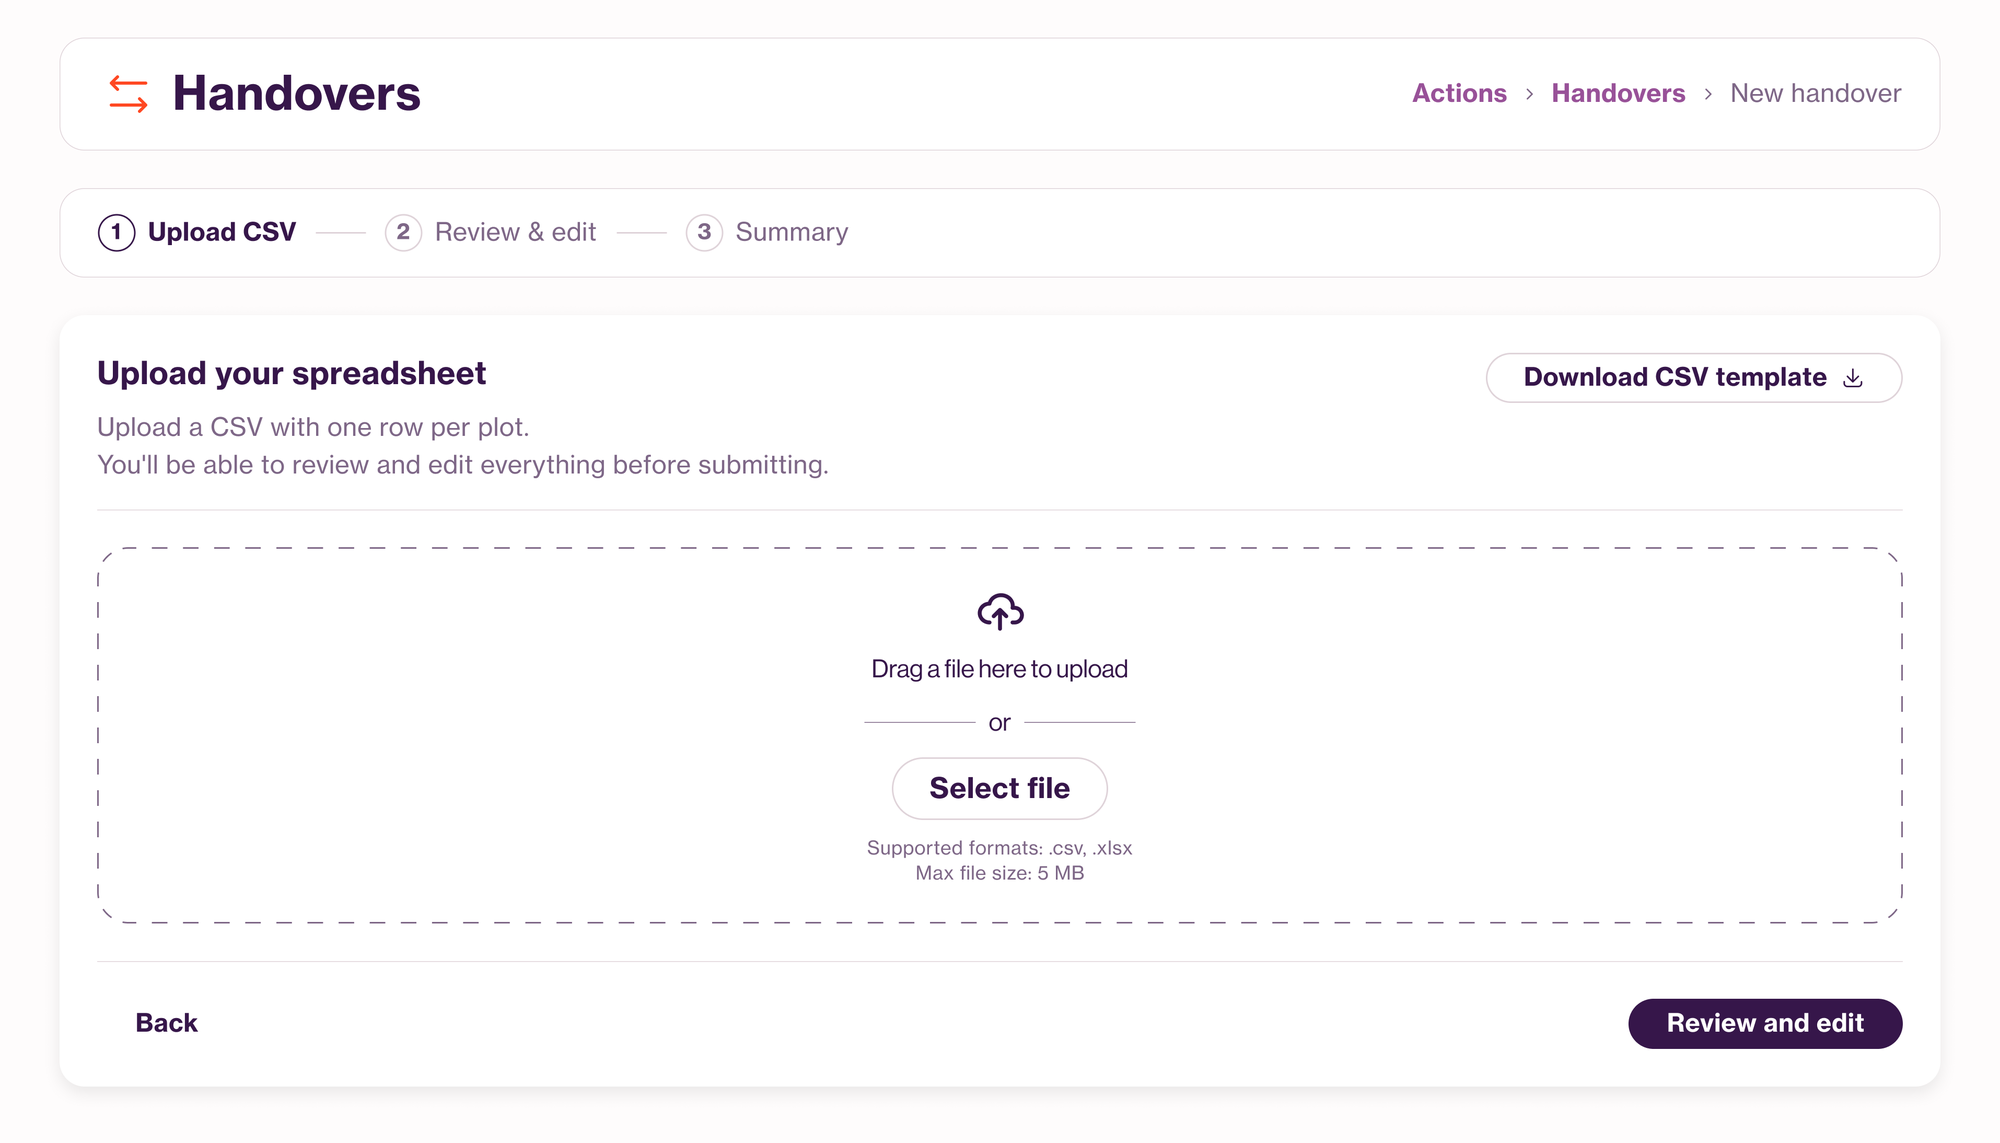
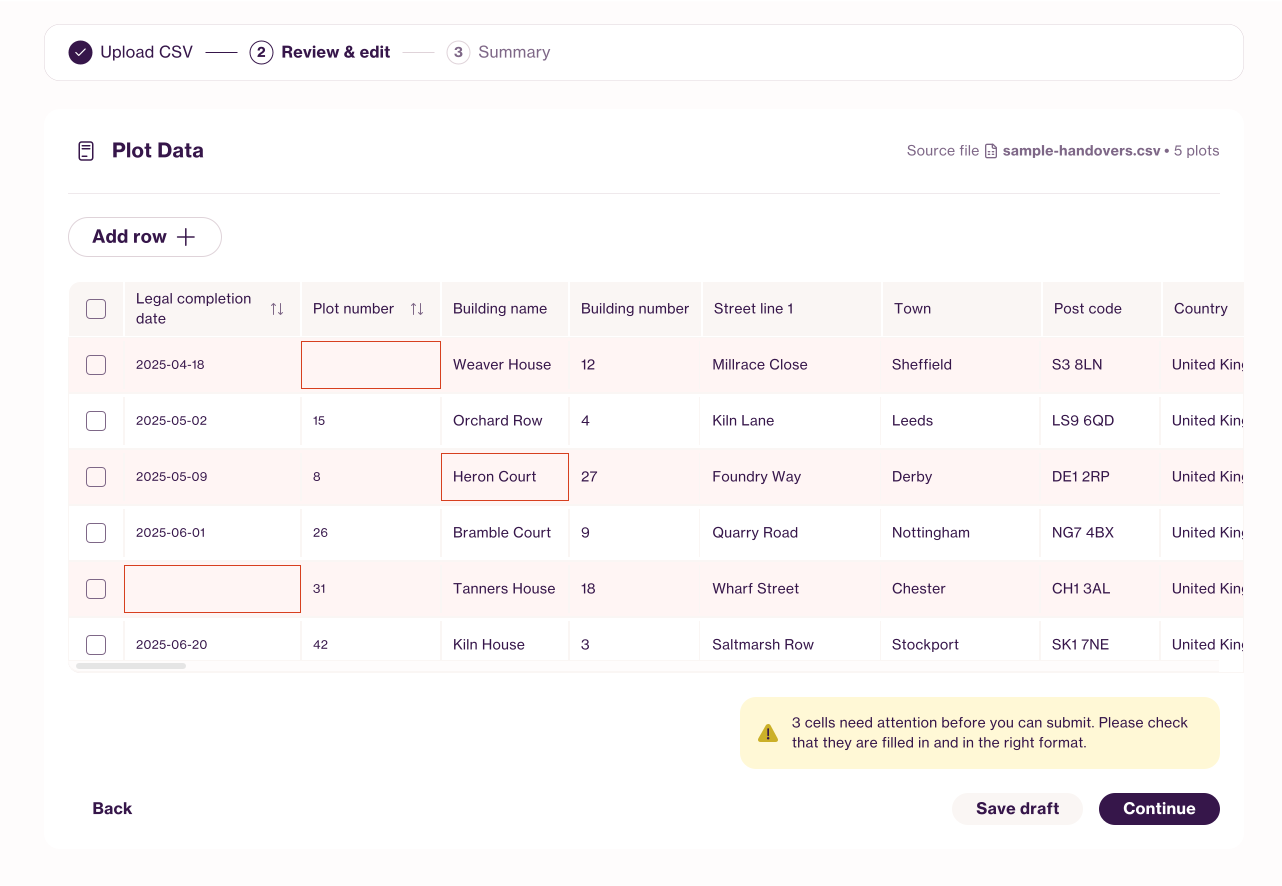
bulk handovers from a spreadsheet >
For the teams not ready to change I designed an interim bridge.
They can keep filling the spreadsheet they use today, upload it to Gateway as a CSV, and Gateway highlights every missing field and mismatched detail before submission.
next steps
Building up features to release
the £4m handover debt
stage #01
Single plot flow
53% of all handovers arrive as single plots, so this flow has been finalised and will ship soon.
stage #02
Bulk handover
Bulk handover from a spreadsheet has undergone another round of testing with positive signals. I'm now working with the devs on the build.
the goal
Debt release
To release a meaningful share of the £4 million tied up in the handover debt book. For customers, it means moving into a new home and setting up an energy account straight away.
“Oh yeah, I think this is going to work. It's way easier than I thought it could be.”
@Property developer“Isn't it wonderful, bring it on, let's get this as soon as we possibly can.”
@Debt team, E.ON Nextkey learnings
Meeting users halfway
I had a clear vision of how an efficient handover would work, but testing proved the overall better way is not always better for the users. Some of our users were so used to their old ways that implementing too much change at once could lose them.

Sometimes the best solution is one that meets people halfway to start with.
View next project